To Use CASE WHEN Statement in Google Data Studio
Differentiating Users:
- Create a pie chart with dimensions and metrics.
- Create a new field and use a CASE statement to categorize users from the USA as “High Conversion” and others as “Average Conversion“
Emojis for Device Categories:
- Create a pie chart with dimensions and metrics.
- Create a new field and use multiple WHEN clauses in a CASE statement to replace device category names with emojis.
Categorizing Traffic Sources:
- Create a table chart with dimensions and metrics.
- Create a new field and use a CASE statement to categorize traffic mediums into “Paid Channel” or “Organic Channel” based on conditions.
Hi, today we will learn how to use case statements in Google Data Studio. We have already seen many things, but still, there are so many features and functions in Data Studio to use and create more interactive and customized reports. So, today, a case statement is the concept we are going to learn. Case Statements work like If else conditions. We have already learned the IFS function in Google sheets, and we all understand the basic concept behind it. We tell the system to check a condition and tell the system to perform a set of tasks if the condition is true, and some other task(s) if the condition is false.
It’s called If else block in the context of programming, and this is what we are going to learn practically with various use cases.
When to Use CASE Statement in Google Data Studio
Sometimes, we don’t have some special requirements, and we do not have enough built-in features or functionalities to achieve the desired result. We can use filters, custom fields, and so many things to render the visualization on a specific filter. But, use cases are more advanced, we simply write logic following the syntax rules for Data Studio, similar to Google Sheets, we have learned so many functions, and custom formulas in Sheets on this blog.
Case statements can help you define a complete block of IF and ELSE and without using any filter we will work on it internally, which means viewers cannot change this statement or even tweak it for some changes. Statements are fixed and can be only edited, or updated by the owner.
Let’s say I want to check if my traffic is coming from paid sources or organic sources. I cannot use any filter here since I don’t have any prior metrics that can determine whether the source is whether organic or paid. There can be so many situations and use cases like this where we don’t have compatible metrics or categories to apply a filter.
It’s also used for grouping the data based on a condition, such as if the elements in a category are divisible by two, then put them into odd number buckets, and else put the rest into odd number buckets. This is just a very basic example of understanding Case Statements in Google Data Studio. Therefore, we need to learn how to use case statements in Google Data Studio.
How to Use CASE Statement in Google Data Studio
Here, we will learn to use Case statements using various conditions. Mostly, use cases have IF ELSE like conditions, but there is no IF keyword. It is written more like a SQL query. We will consider some sample data and will perform a case statement to see if it solves our problem and give us useful insights.
How CASE WHEN Statement works in Google Data Studio
A CASE statement expression always starts with the CASE keyword in the first line and ends with the END keyword in the last line. This can be said as a CASE block in our query. In between, you’ll have several sections or “clauses“, they start with a WHEN keyword, and IN is used to check the condition for example
CASE
WHEN country IN (“USA”,” Canada”) then “high conversion” else “average conversion”
END
- WHEN: a condition or statement you want to check. You can also have multiple WHEN clauses in a single CASE expression right after one (before the END keyword)
- THEN: It works like the result to return if the WHEN clause’s condition is true. You must have one THEN for each WHEN clause in each CASE statement.
- ELSE. It’s the opposite of THEN, when then is not true the function will jump to the else block, and execute anything written in this block. It’s an optional clause.
How to Use Case Statements in Google Data Studio – Example 1
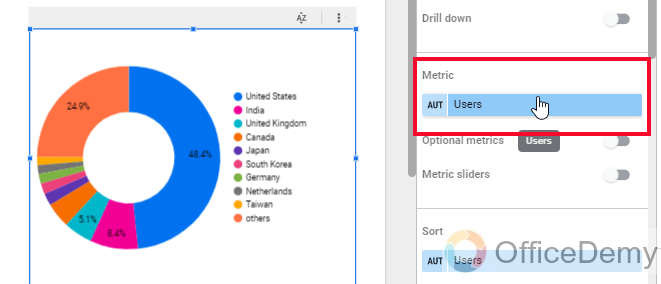
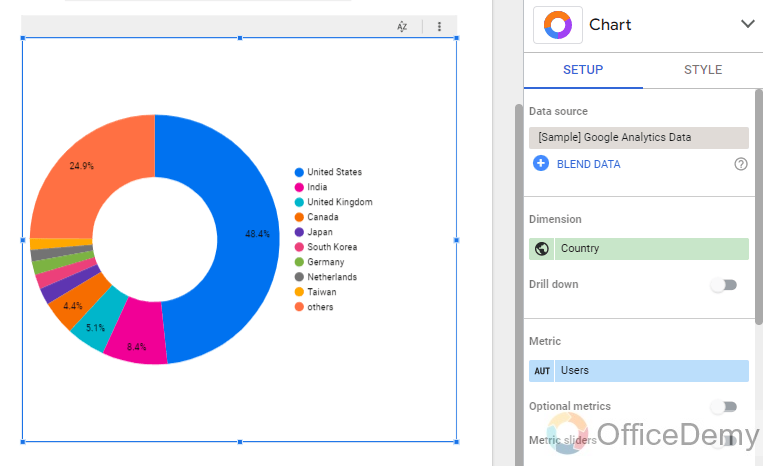
In this use case, we will see how to use case statements in Google Data Studio. We will learn using a practical example. So, I have my users as metrics, and the region as dimension, and they are in a pie chart. Now, what I want is to write a case statement to differentiate the users from the USA as the highly profitable users, and the rest as average profitable users, and I want to show this breakdown in my chart or maybe in other charts using cross-filtering.
Let’s first set up the chart then we will write the case statement.
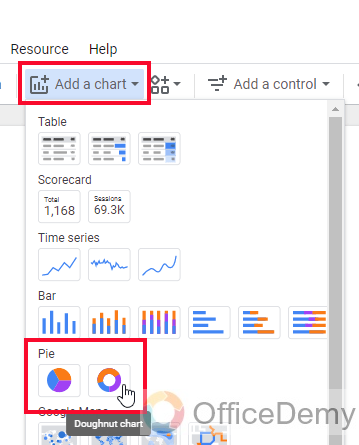
Step 1
Create a pie chart
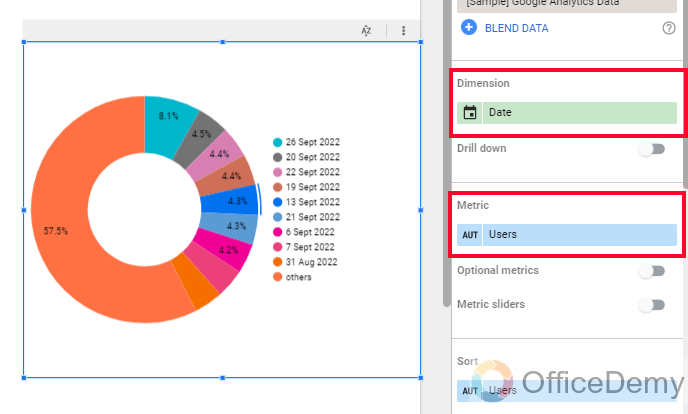
Step 2
Set the dimension as Country
Step 3
Set the metric as users
Step 4
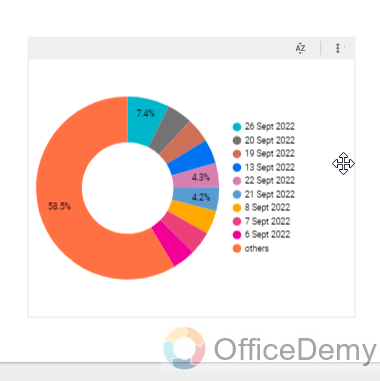
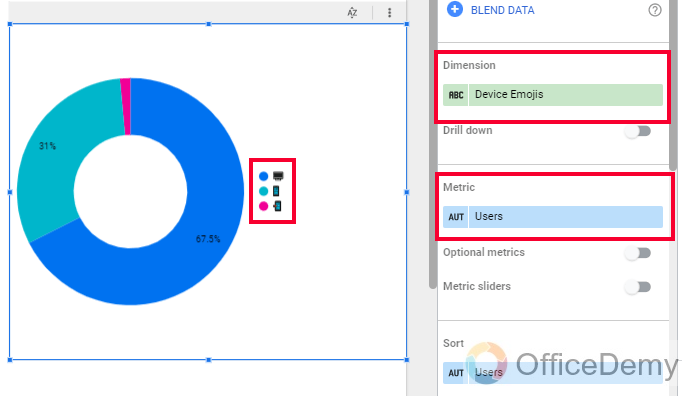
Now you can see the breakdown of the users based on their countries
Step 5
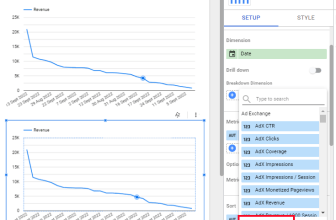
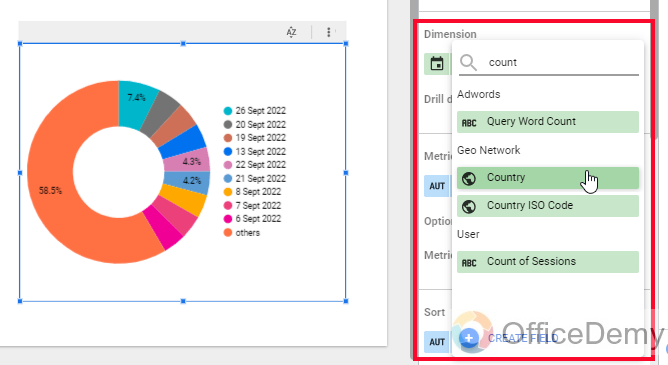
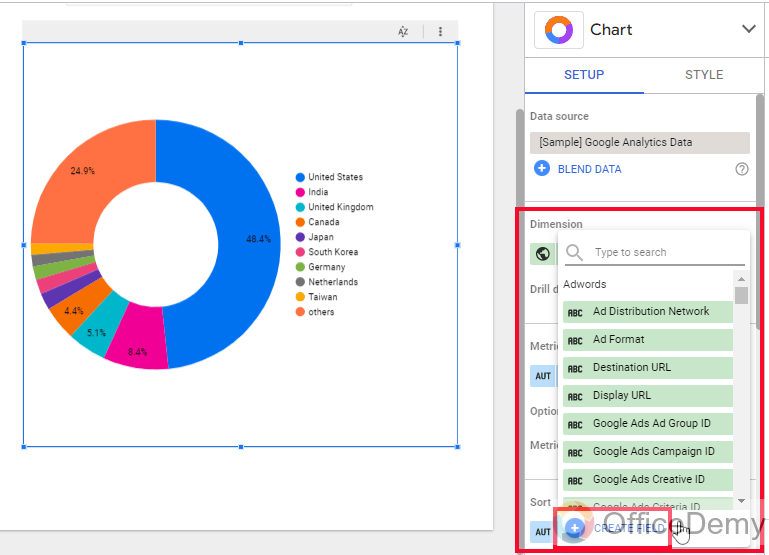
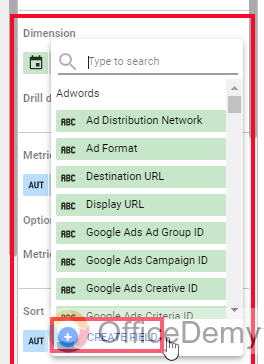
Now go to dimension, and click on create a field
Step 6
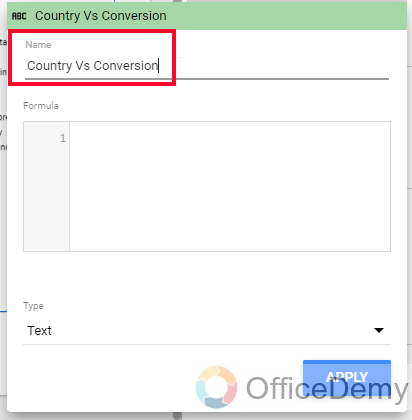
Give this field a name
Step 7
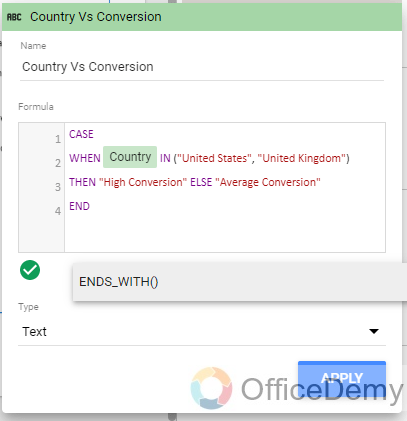
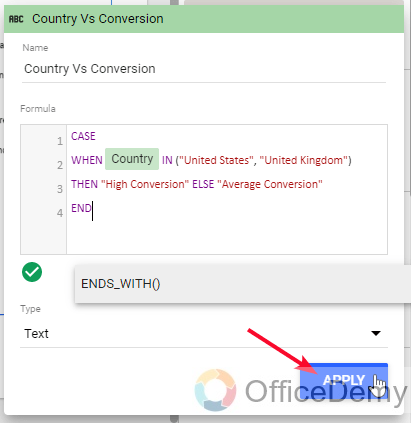
Below, write the case statement
Set UK and USA as the high conversing countries and rest as average.
CASE
WHEN Country IN (“United States”, “United Kingdom”)
THEN “High Conversion” ELSE “Average Conversion”
END
Step 8
Click on Apply to save changes
Step 9
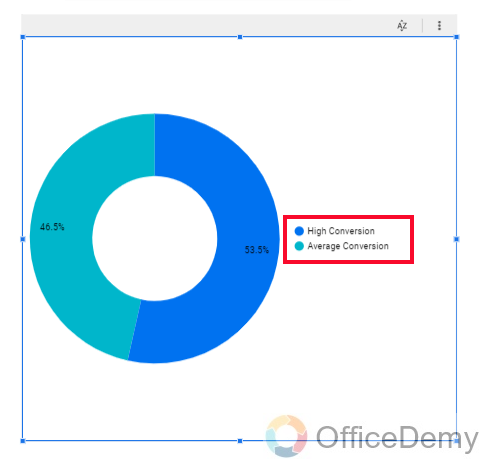
You can see we have successfully breakdown the users from USA and UK, as the first category, and all others in the second category
This is how we use case statements, just like IF else conditions, there can be many more similar use cases it is up to you what you want.
How to Use Case Statements in Google Data Studio – Example 2
In this example, we will learn how to use case statements in Google Data Studio using another use case, here I have a device category breakdown for my users metric. What I want, I want to remove the names of the categories such as mobile, desktop, and tablet, and I want to add emoji characters for them. We can easily do this using multiple WHEN clauses case statements to create a dimension field.
Let’s start, again we will use a pie chart.
Step 1
Create a pie chart
Step 2
Select metric as users and dimension as default
Step 3
Go to dimension and click on create a field
Step 4
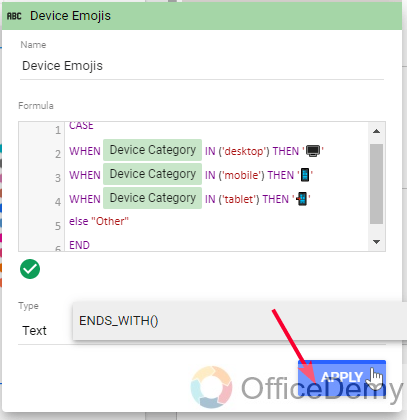
Assign a name to your field, and start writing the case statement
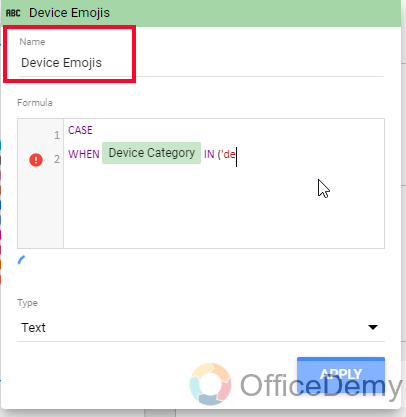
Step 5
Write and when clause and evaluate the category and assign an emoji as a string
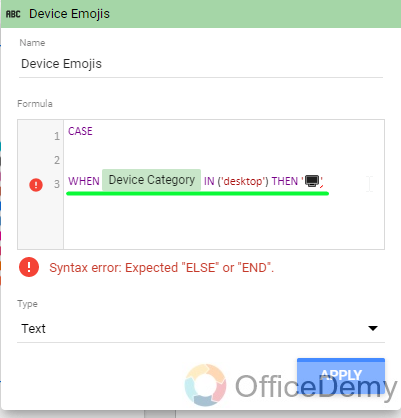
Step 6
Repeat the above step for all three categories
The overall formula will be below:
CASE
WHEN device category IN (‘desktop’) THEN ’emoji’
WHEN device category IN (‘mobile’) THEN ’emoji’
WHEN device category IN (‘tablet’) THEN ’emoji’
ELSE “Other”
END
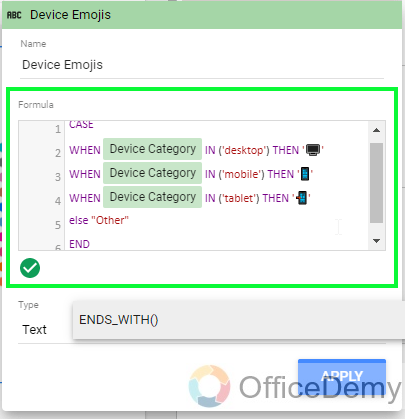
Step 7
Click on apply, this is how can have the categories’ names as emojis in your chart
How to Use Case Statements in Google Data Studio – Example 3
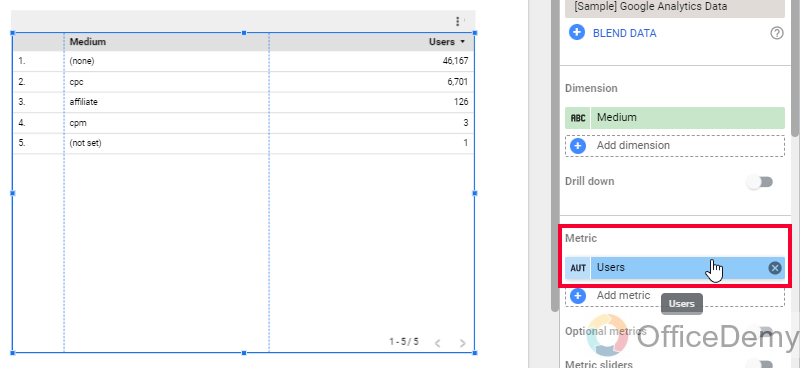
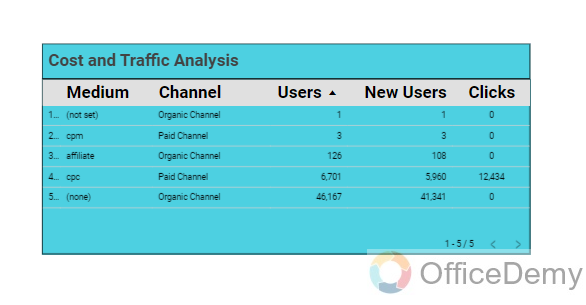
Here we will learn how to use case statements in Google Data Studio and will see another example. In this example I am using a table chart in which I have a medium as dimension and users as metric, I have various mediums from which my users are coming, now I want to break down these mediums into two categories, one is paid channel, and other is the organic channel. I don’t have any metrics or dimensions to do this, so I will use a case statement here.
Let’s practically do this.
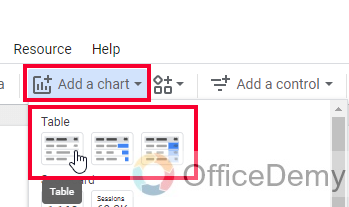
Step 1
Create a table
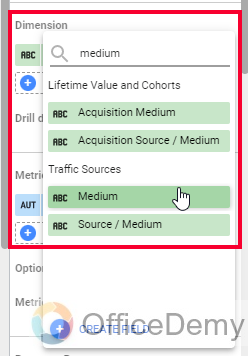
Step 2
Set medium as dimension and users as the metric
Step 3
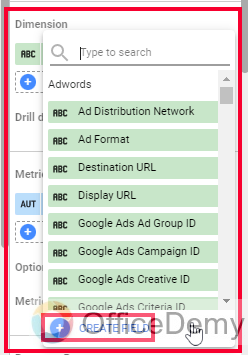
Now go to dimension, and create a field
Step 4
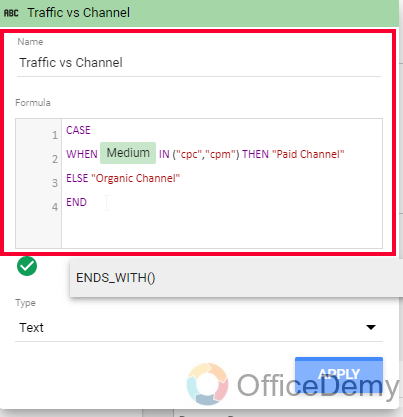
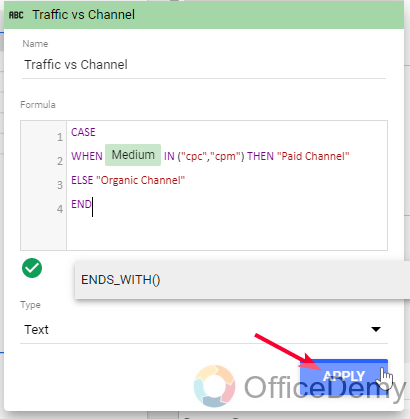
Name the field, and then start writing the case statement, we will simply see if the medium is CPC or CPM, then these are paid channels, or the rest all are the organics channels, so a simple If else statement is required here
Step 5
Once you’re done, click on Apply button
Step 6
You can see we have successfully a new dimension which is determining the channel type.
After some editing, the table looks like below
I hope you have understood the importance of using statements in Google Data Studio.
This is how we use case statements for creating new categories in our data, and grouping our data in many possible ways as we need.
I hope you find the above examples and explanations helpful.
Important Notes
- Just like fields we created for metrics, case statements work on dimensions.
- The case statements can have multiple WHEN clauses and one THEN clause for every WHEN clause
- ELSE is an optional clause
- CASE keyword for starting and END keyword for the ending is mandatory.
- Case Statements are only for dimensions and not for metrics.
Frequently Asked Questions
How to edit a case statement?
When you use a custom dimension created by a case statement to show data in the chart, it can be edited by clicking on the small function icon (fx) left to its name inside the dimension section. There is no other way to edit or update these case statements other than this.
Can I delete a dimension?
Yes, you can delete a custom dimension that is created by a case statement, simply go to edit mode of the statement, and then remove the case written in it, also remove its name and it will be an empty case statement, click anywhere outside the field body, and now you will not see this dimension again.
If you are talking about a dimension that is coming from the source, then you cannot delete it here, you need to delete it from the source data.
Conclusion
So, how do you see the case statements? In this tutorial, we covered how to use case statements in Google Data Studio. We first see the syntax and basic usage of use statements; I compared them with the IF else statement and IFS function of Google Sheets. It has the same logic behind it, the difference is syntax. Case Statements are written like SQL queries, and they don’t have IF keywords, instead, we have WHEN, THEN, CASE, ELSE, and END keywords that can be said clauses.
I hope you liked today’s article. Thanks for reading. Keep learning with Office Demy.