
To Make a Chart on Google Docs
- Place your cursor where you want to insert the chart.
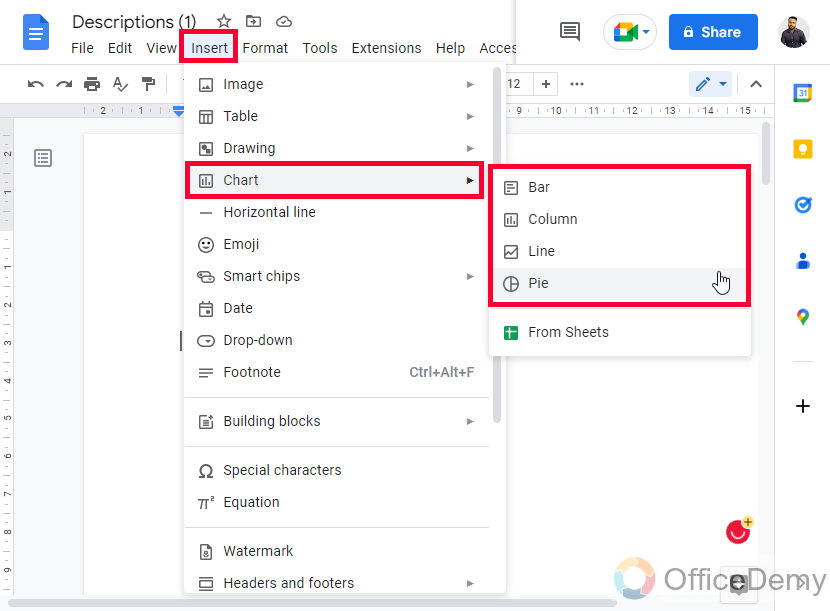
- Go to “Insert” > “Chart” > Select any Chart.
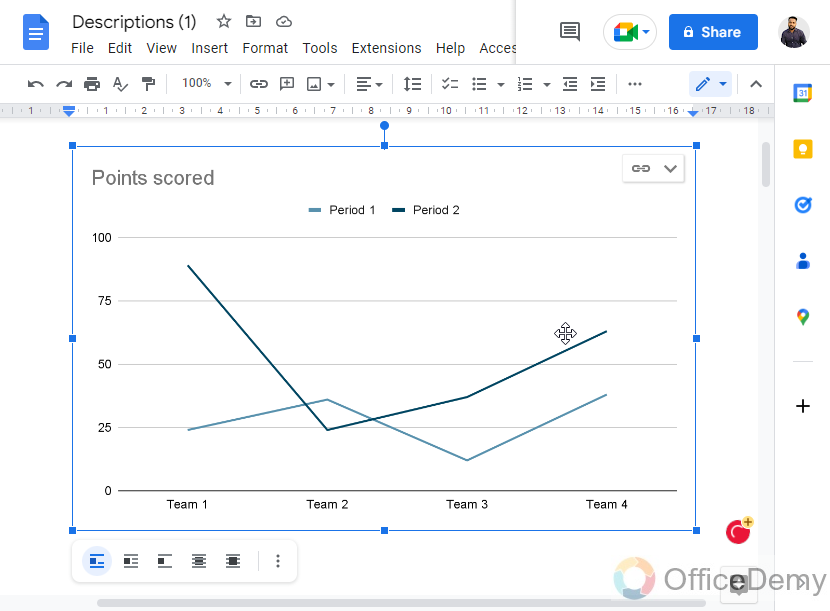
- The chart will be added with sample data.
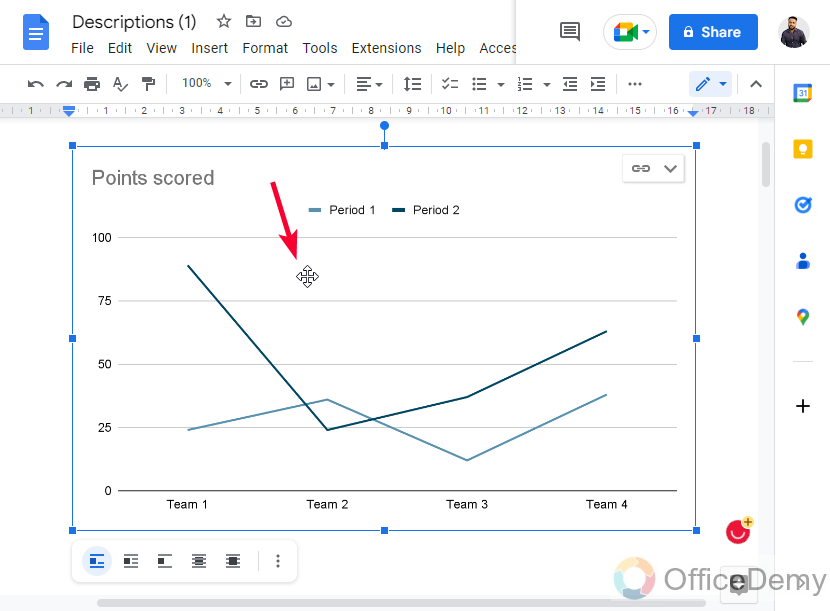
- Select the chart.
- Click the drop-down icon in the top-right corner.
- Choose “Open Source“.
- Modify the data source in the Google Sheets file.
- Open the Google Docs document and click “Update” to reflect the changes.
Hi. In this article, we will learn how to make a chart on Google Docs. We all love visualizations over textual data. Charts and graphs give us a better understanding of the data as compared to the text and numbers. In Google Docs, we have some built-in charts templates, we can create and manipulate them with real-world data. Charts are fully customizable as well and can be very good when it comes to data presentation. Charts take less time to deliver the message and are more communicative and interactive. Google Docs charts are similar to Google Sheets charts but here we have a smaller number of charts compared to Sheets.
Google Docs offers some major chart options, and there is also a way to get a chart from a sheets file saved in Google Drive. If you want to create a GEO chart in Google Docs, well it’s not directly available in Docs, but getting it from the sheets file is possible and very easy. I will show you how to do that later in this tutorial.
Importance of making Chart on Google Docs
As we all know that charts and graphs are a better and more convenient way of visualizing any type of data. Charts help to deliver the data very quickly and make readers understand it briskly.
Do you have some data in textual form, and do you want to visualize it in some charts or graphs? It’s absolutely easy and quick in Google Docs. You should know what type of chart you want to make in Google Docs. If the chart is available in Docs, then well and good, and if not available then you need a little help from sheets.
We may need to make a chart on Google Docs for so many reasons.
- Making comparisons between different data values
- Increases or decreases in data sets into charts in real-time
- Percentages of data with each other
- Changes in data sets over time or any other metric
Google Docs is more used for typing, script writing, documentation, and article writing, but still, Google Docs has a built-in chart creation tool that can be used to create some real-time charts based on your data from any Google Sheets source Here, I will first take teach some basics of creating and manipulating built-in charts in Google Docs. So, these are some of the many reasons to learn how to make a chart on Google Docs.
How to Make a Chart on Google Docs
In this section, we will first see what charts are available and how they can be created, then we will see how to add data sources to charts from an external sheets file, then we will see how to import pre-made charts from Google Sheets, and then we will see some basic customization features of the charts. So, this tutorial is going to solve any of your problems related to charts. Let’s get started.
How to Make a Chart on Google Docs and Manipulate Data source
In this first section, we will learn how to make a chart on Google Docs. Well, it’s pretty easy, we will all the charts and then we will move further to the data sources.
Step 1
Place your cursor where you want to insert a chart
Step 2
Go to Insert > Chart > Select anyone from the list
Step 3
The chart is added
Similarly, you can add any chart from the four charts listed inside the Chart section
Note: There is no data associated with the chart, so Google Docs will automatically assume some data from the document, and will make it to the chart, but what we normally do when creating charts in Google Docs. We connect data sources; we use Google Sheets for this.
Let’s see how to connect this chart to Google Sheets data.
Step 4
Select the chart
Step 5
Click on the drop-down icon in the top-right corner and then click on Open Source
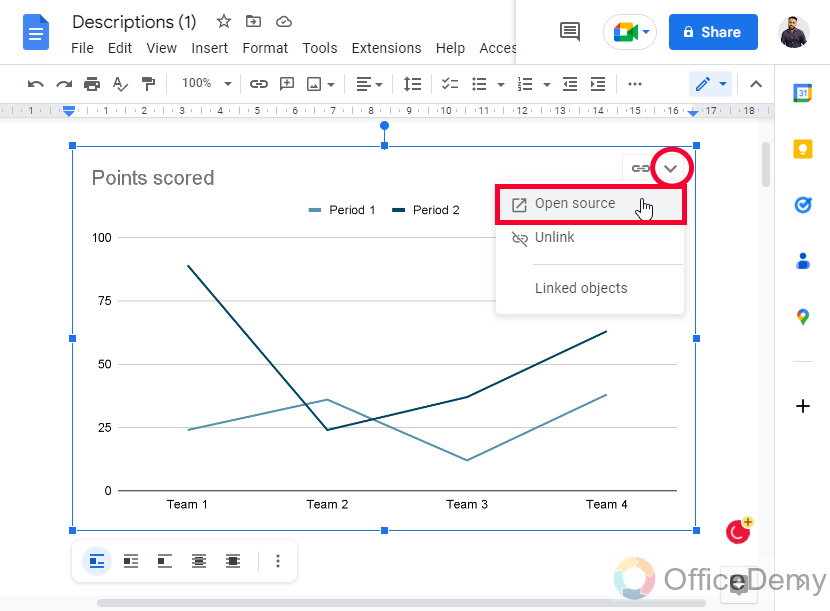
Step 6
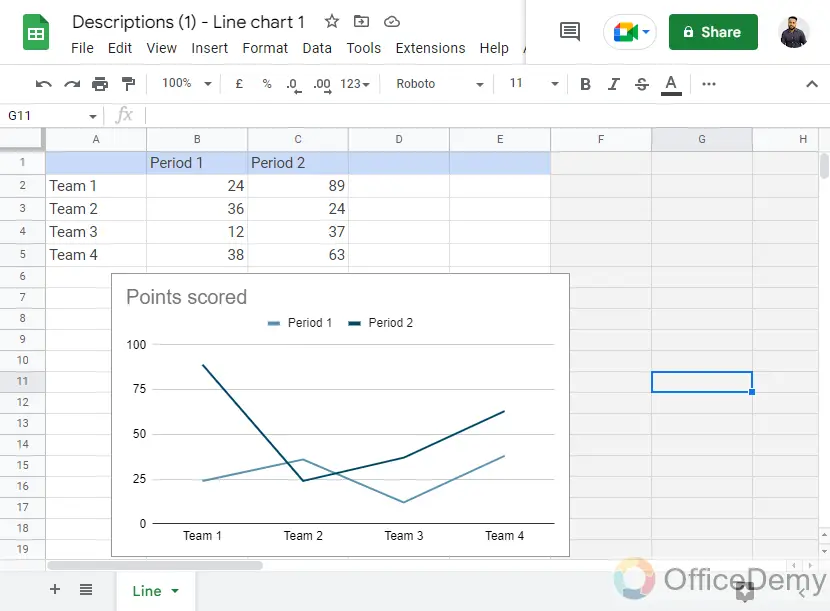
A new tab will open, and you can see a sample sheets file here with some data. Now, this is your source Google Sheets file for this chart, you can remove the sample data and can add whatever data you want to show in the Chart you made in the Docs file.
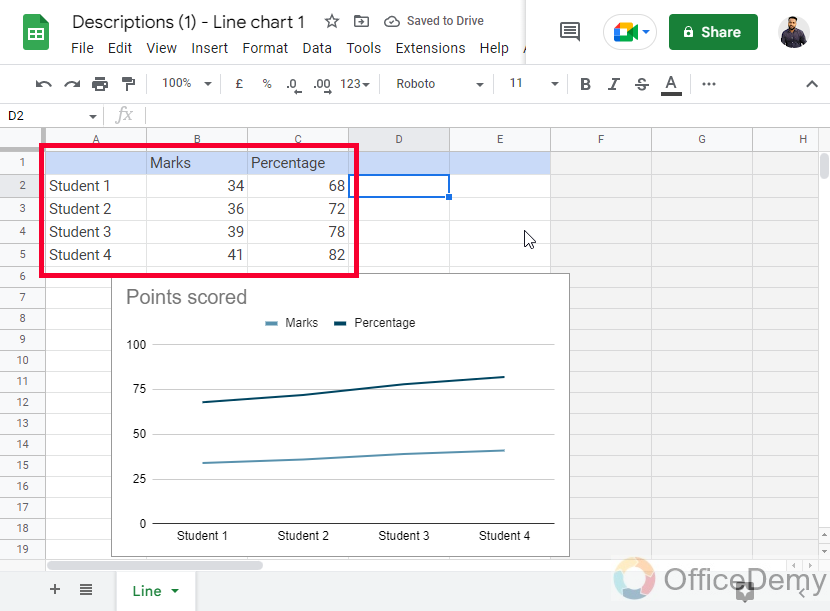
Step 7
Now I will manipulate this data into a custom data set
Step 8
Now back to the Docs, and click on the Update button on the chart
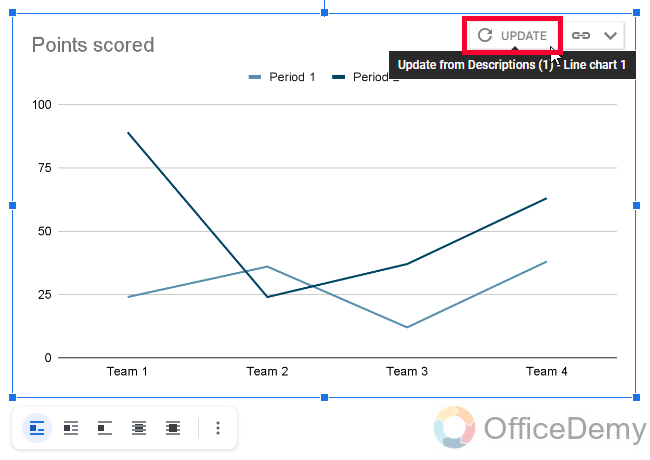
Step 9
You can see the chart is updated.
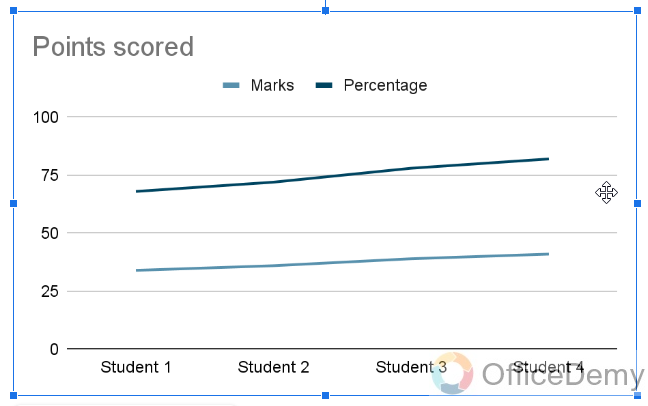
So, this is how you make a chart on Google Docs, and manipulate the data source from the associated Google Sheets file.
How to Make a Chart on Google Docs – Customization of a Chart
In this section, we will learn how to make a chart on Google Docs, and we will see how to customize a chart in Google Docs. Now, if you already have worked with Google Sheets charts, then you must know that in Google Docs, the customization is different. There are two means when I say customization of charts in Google Docs. We can either customize our chart inside our associated Google Sheets file. The data comes from a sheets file, and the chart is also there with the data, we can double-click the chart in the sheets file and we have the same chart editor sidebar as we had in Google Sheets. So, I will not go to those customizations. Because we have already learned a lot about that.
The other meaning is to customize your chart as an image inside Google Docs. Well, the chart in the Docs file is compiled as an image by the Google Docs interpreter. So, we understandably have all the editing and customization features of images in our charts. So, let’s see what we can do.
Step 1
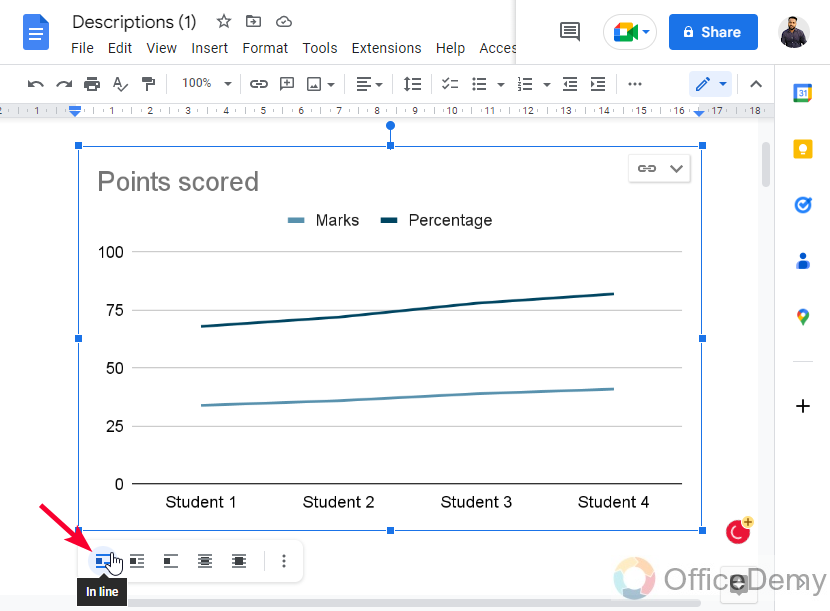
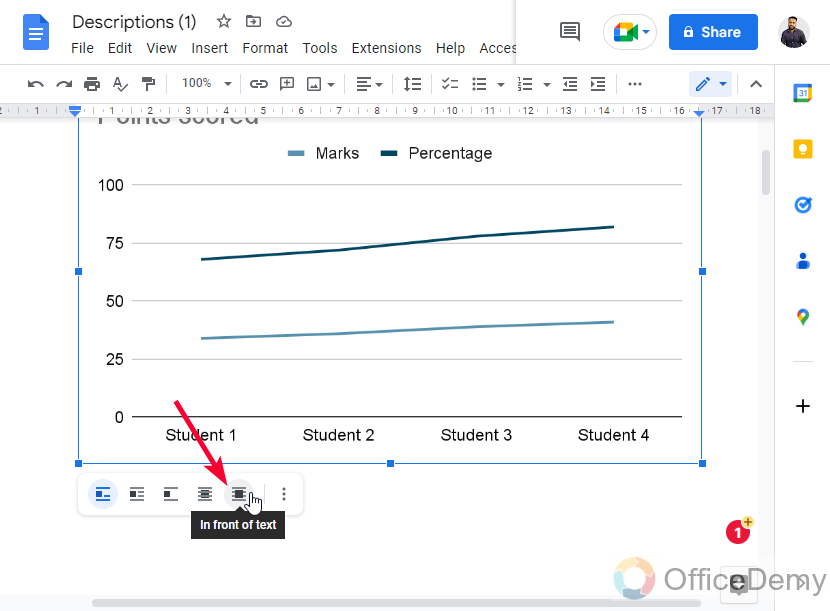
Set the chart’s position using the below buttons when you select the chart on Google Docs.
Here you can use
Inline
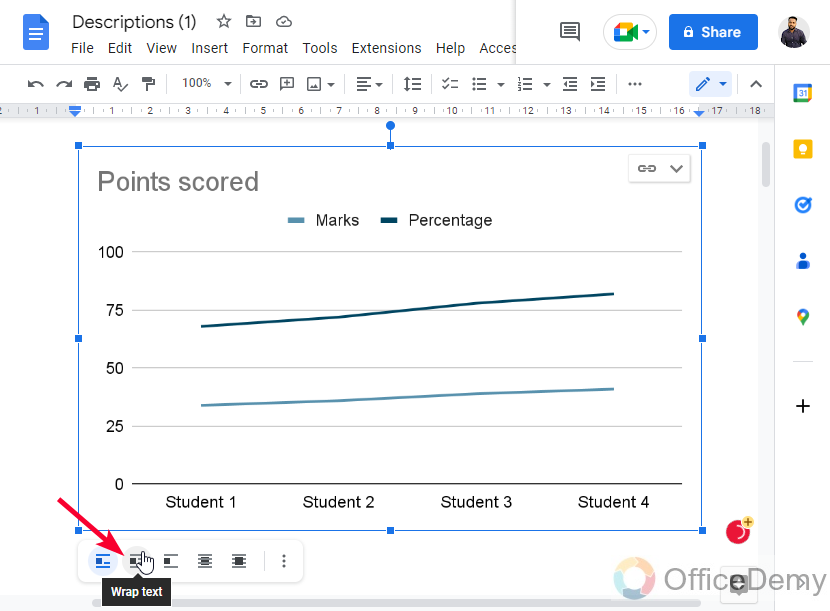
Wrap text
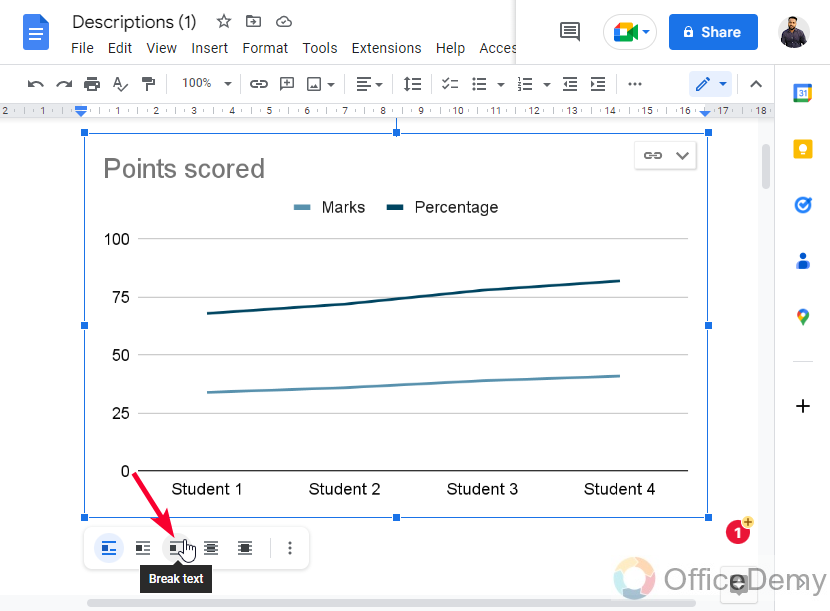
Break text
Behind text
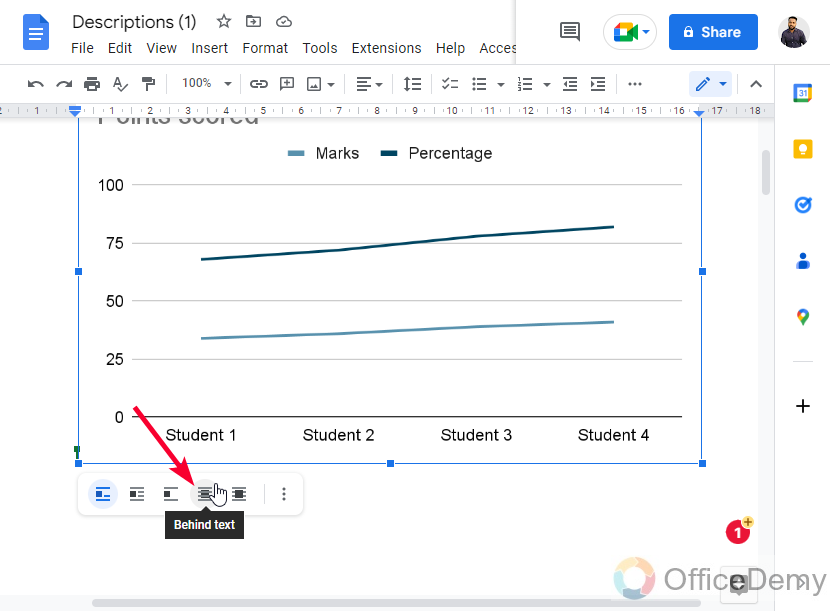
In front of text
Step 2
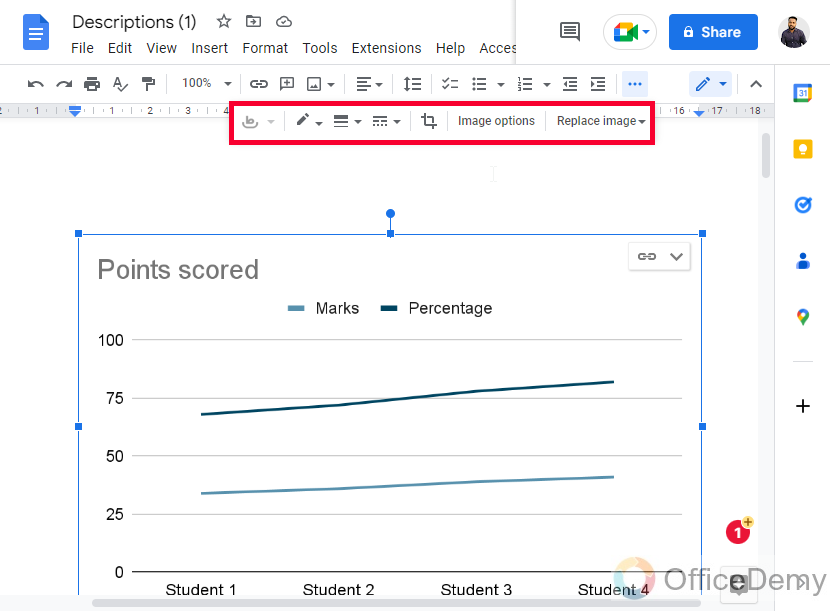
You can use all the options of the toolbar by selecting the chart’s image in Google docs.
We can align charts, set border width, style, and color for the chart, and crop it.
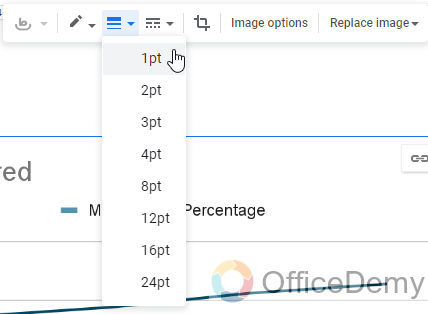
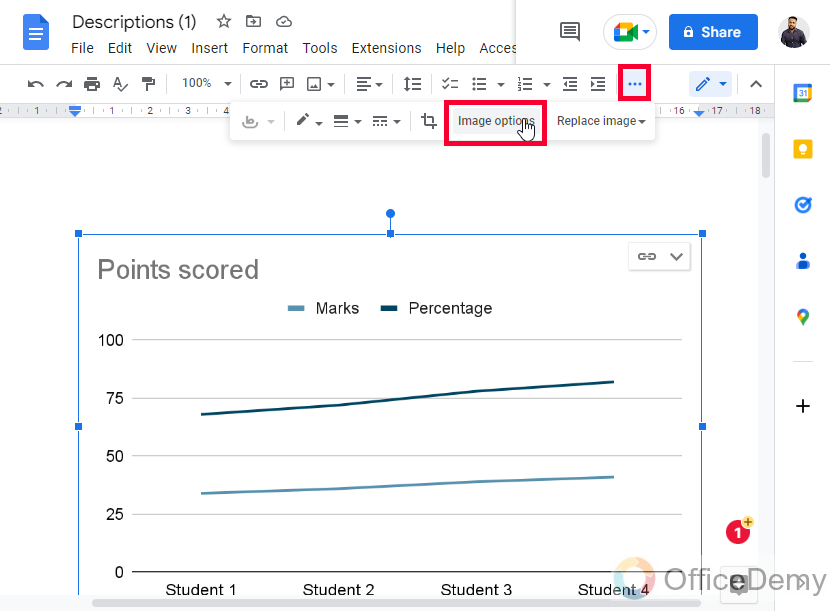
Step 3
Now we have some detailed image options in the toolbar, click on the button to expand
Here we have:
- Size and rotation
- Text wrapping
- Recolor
- Adjustments
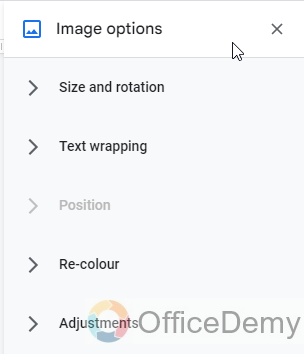
Note: We can also control the opacity of the chart using the adjustment dropdown in the image options tool.
How to Make a Chart on Google Docs – Import a Chart from Sheets
In this section, we will learn how to make a chart on Google Docs, and specifically, we will see how to import a chart from Sheets. What we did do in previous sections? We made charts inside Google Docs. Now, we will not make a chart from scratch, but we will get a pre-made chart from the Sheets. You must have a sheets file in your Google Drive (same Google Account), to import the chart into Google Docs. So, let’s begin.
Step 1
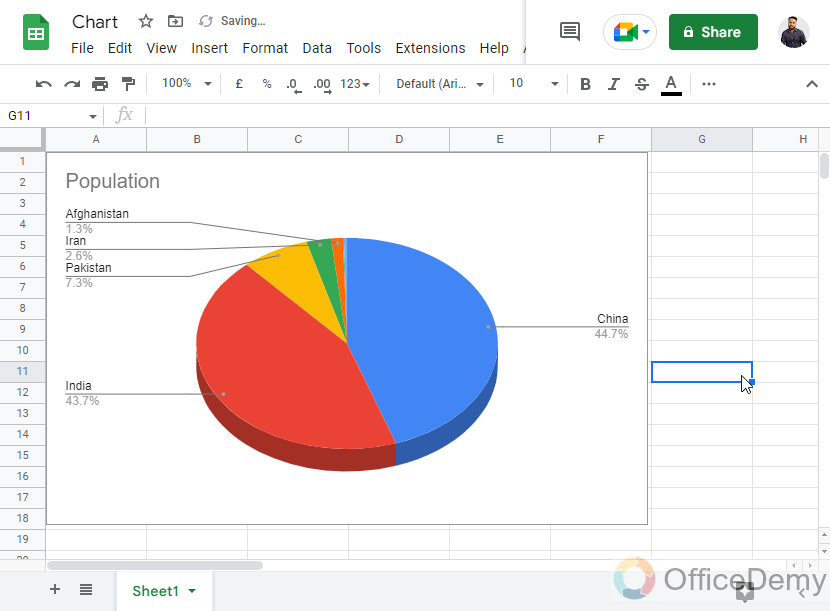
Make a chart in Google Sheets, and save it to Google Drive (automatically will be saved in your Drive)
Step 2
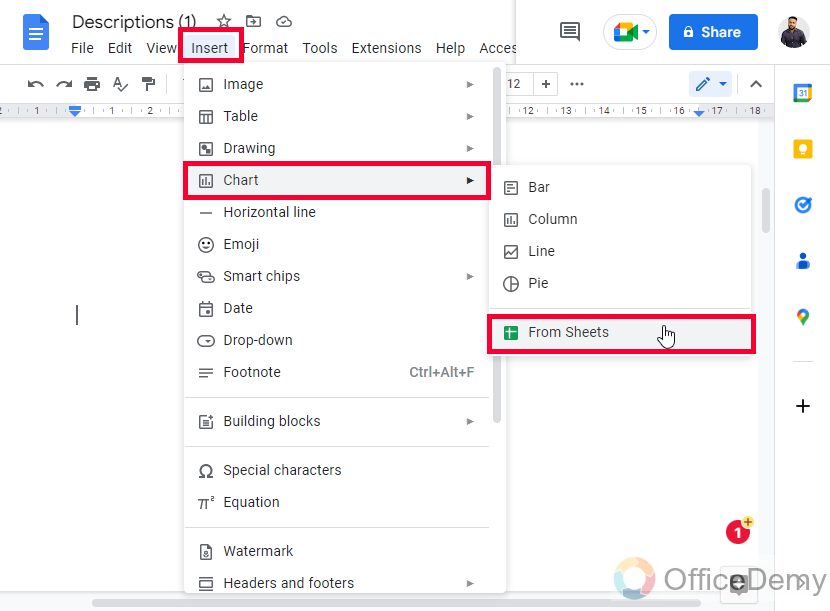
Now go to Docs click on the Insert tab, then Go to Charts > and Click on From Sheets
Step 3
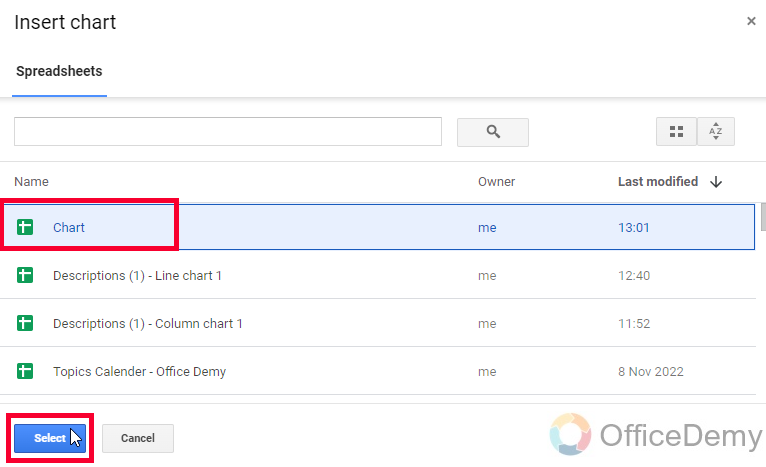
Select the file in which you have your chart, and click on the Select button
Step 4
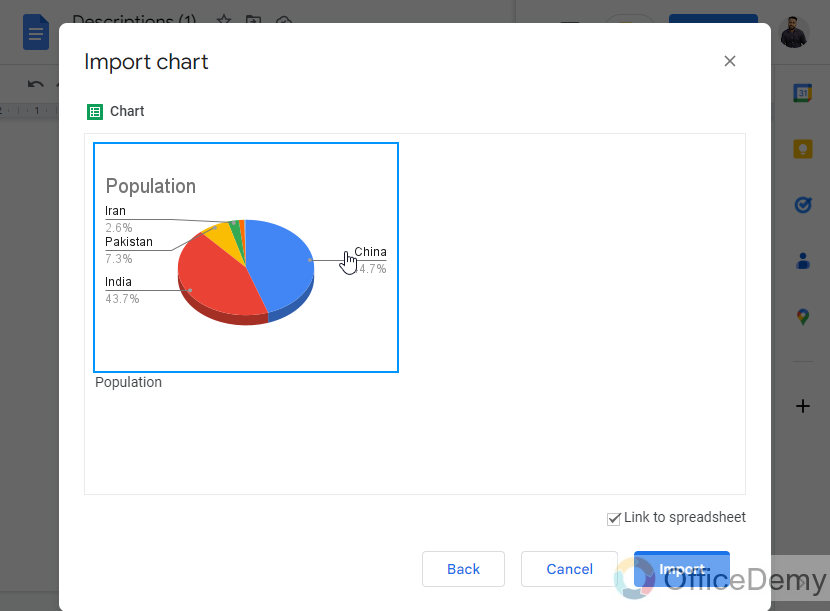
Select the chart from the list (Will show all the charts you have in the selected Sheets file, since I have only one so it will show only one)
Step 5
See the checkmark below, link to the spreadsheet, by default it’s checked (It will take the changes made in sheets if the checkmark is checked, and will not take any changes in the future if the checkmark is unchecked) It depends, if you want to take only a static image of the chart then uncheck it, else check it.
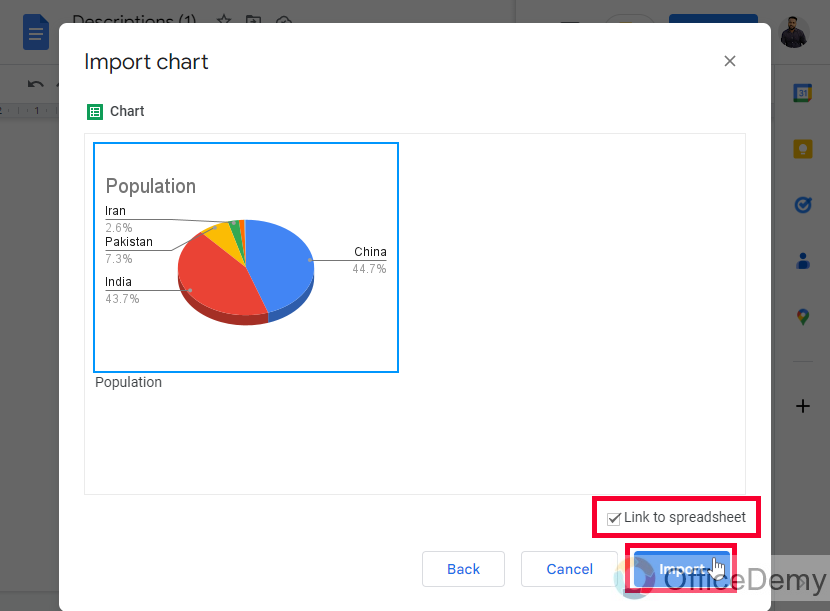
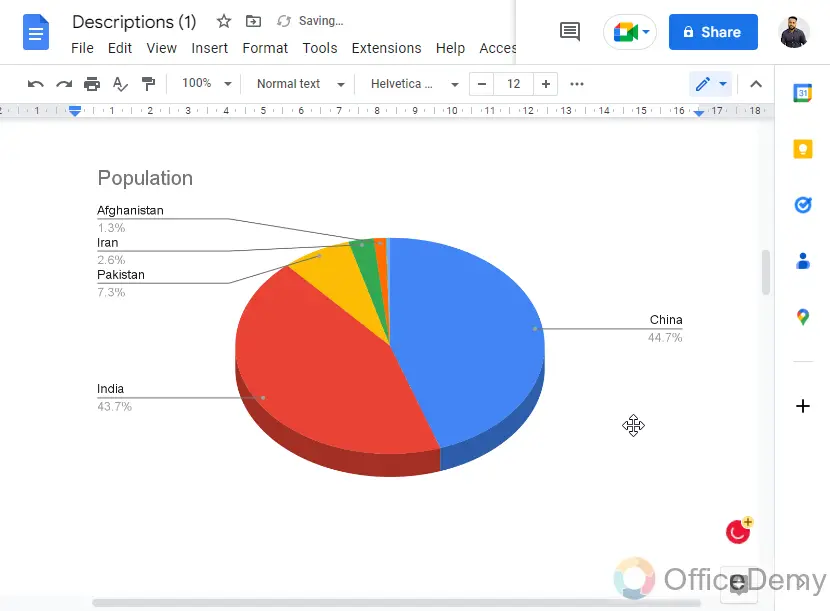
Step 6
The chart is added to Docs.
So, this is how to import a chart from Sheets. I hope you like this tutorial.
Frequently Asked Questions
How to import a chart in Google Docs?
You can import a chart in Google Docs from the Sheets file only. The sheets file must have a chart, and then you can go to Insert then chart then From Sheets, and now you need to select your Sheets file, and then click on the select button, now select the chart from the list, and click on the select button, you can check or uncheck the checkbox link to the spreadsheet as you want.
How to make a GEO chart in Google Docs?
There is no direct option in Google Docs to create a GEO chart. Google Docs only offers four types of charts to date. They are Bar, Column, Line, and Pie charts, in case you want to make any other chart such as a GEO chart, then you can use Google Sheets. Make your GEO chart in Google Sheets and then import it to Google Docs as I taught in the last section of this tutorial.
Conclusion
This is all about how to make a chart in Google Docs. I tried to cover various small topics in the scope of this tutorial related to charts in Google Docs. I showed you all the things in step-by-step procedure and images. I hope you have properly learned how to make a chart in Google Docs.
I will see you soon with another helpful tutorial till then take care. Keep learning with Office Demy.
