
To Make a Graph on Google Docs
- Open Google Sheets.
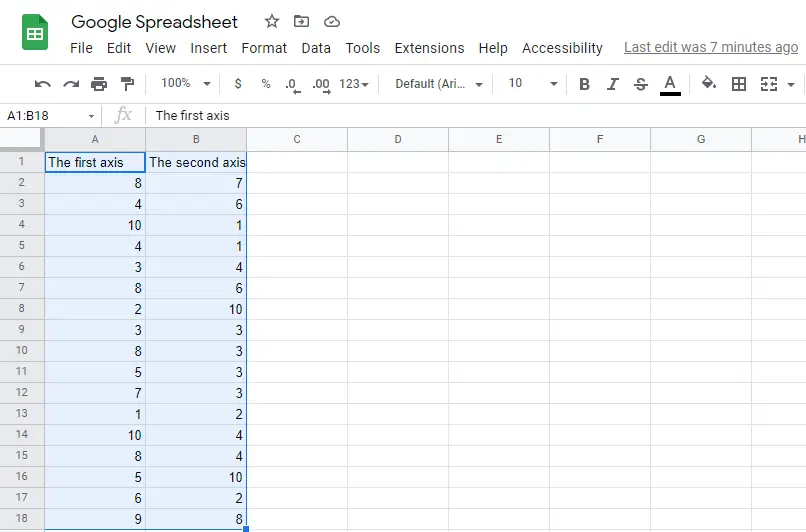
- Select the data cells.
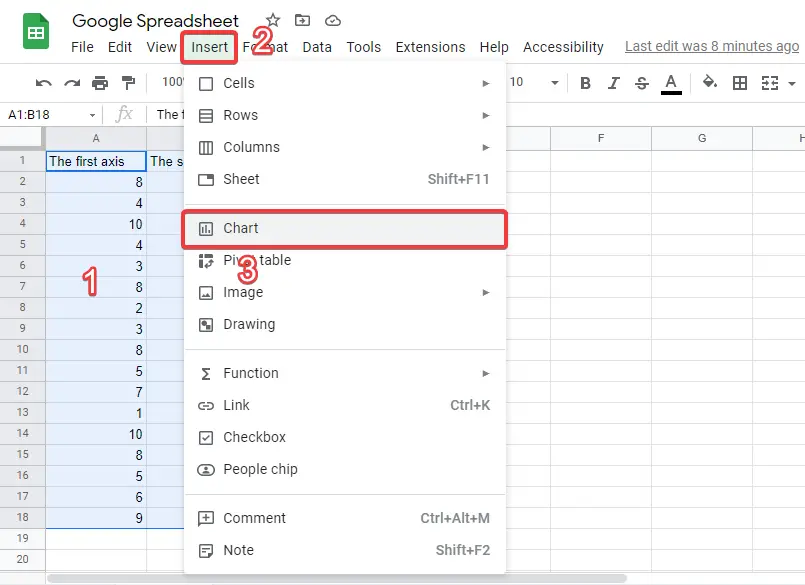
- Click “Insert” > “Chart“.
- The chart will appear.
- Return to your Google Docs document.
- Click “Insert” choose “Chart” and select “From sheets” to insert a chart on Docs.
In this article we will learn about how to make a graph or chart on Google docs.
Google Docs is a free, online, and web-based word processor offered by Google. It has many advantages such as smooth real-time collaboration, the ability to see the history of changes in the document, auto-saving, and the ability to work from anywhere. Whether you are using Google Docs to write a book, a research paper, or your resume, you probably know that the format of the document is as important as the content itself.
Google docs allows you to make graphs or charts that suit your content. In this article, you will find a step-by-step guide on how to make a graph/charts on google docs. But before that, let’s see what graphs is and why they are useful.
Advantages of Adding Graphs/Charts in Google Docs
Before you learn how to make a graph on google docs, you might need to know how they can be useful:
- Adding a graph is totally easy, all you have to do is input the data and then google docs will turn it into a graph with a simple command. Also, you can choose what kind of graph do you want to add such as pie chart, column chart, line chart, and bar chart.
- Displaying the data in a graph will make it easier to understand. For example, you can use it to explain some facts or to highlight a specific part of the data set and so on.
How to Make a Graph or Chart on Google Docs
Adding a graph on google docs is quite simple, all you have to do is input the data and google docs will demonstrate as you want. After this introduction, let’s learn how to make a graph on google docs:
Create Data Set in Google Sheets to Generate Graph or Chart
Unfortunately, there is no way to create a graph directly in google docs, so you have to create it in google sheets and then move it to google docs. Follow these steps:
Step 1:
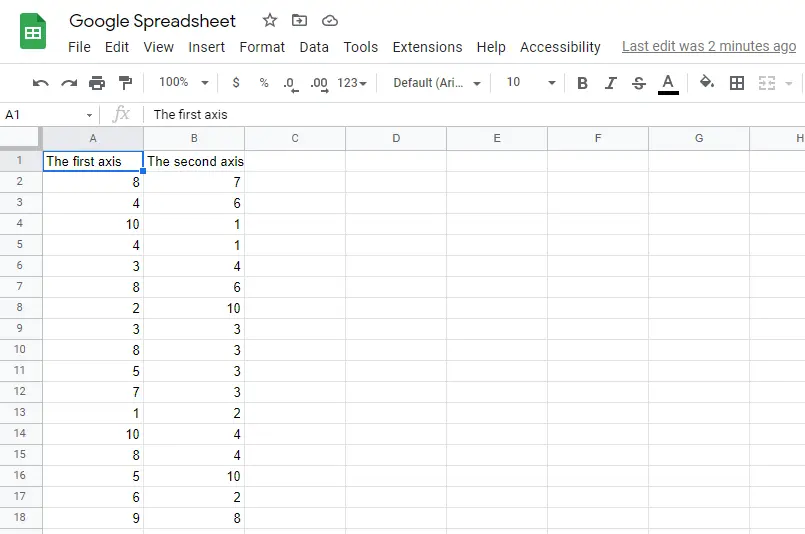
Open the google sheet that contains the data set that you want to add to a graph. If you haven’t created it yet, then open a new google sheet and add the data. To do that, click File and choose New and then click Spreadsheet.
Step 2:
Now that the data set is ready, it’s time to create the graph. First, select the cells that contain the data.
Step 3:
Click Insert in the toolbar and then click Chart.
Step 4:
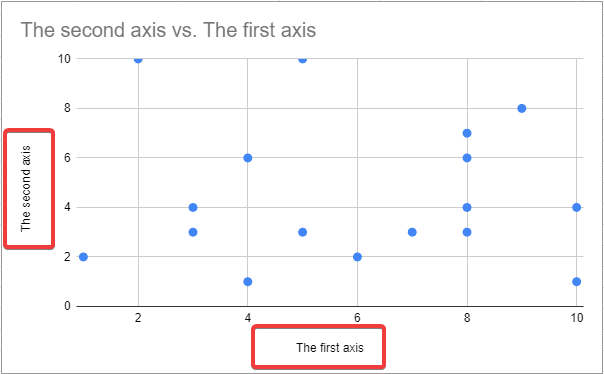
The chart will appear in the sheet automatically
Step 5:
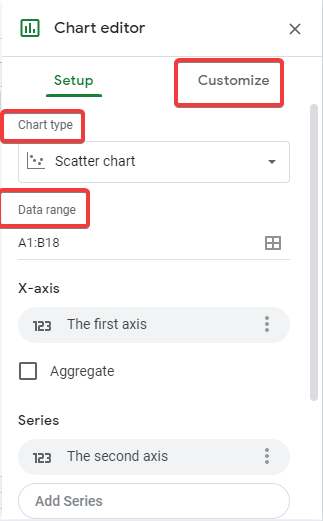
Also, the chart editor will appear which you can use to choose the chart type that suits your data set. Also, you can edit the graph’s properties such as the axes, the axes’ names, colors, etc.
Copy the Graph or Chart from Google Sheets to Google Docs
There is more than one way to copy the graph from google docs to google sheets. Follow these steps:
Step 1:
Go back to the google docs document that you want to add the graph to it.
Step 2:
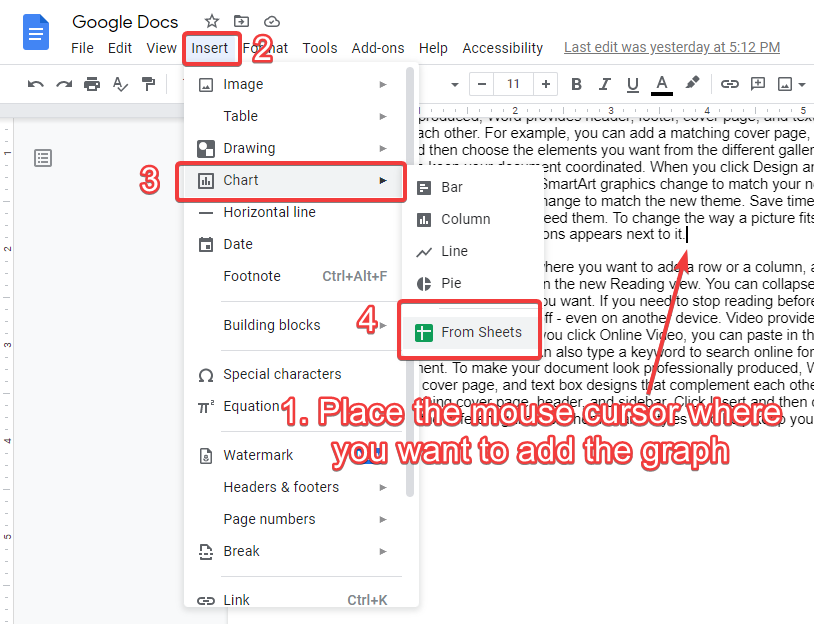
Click Insert and choose Chart and then click From sheets.
Step 3:
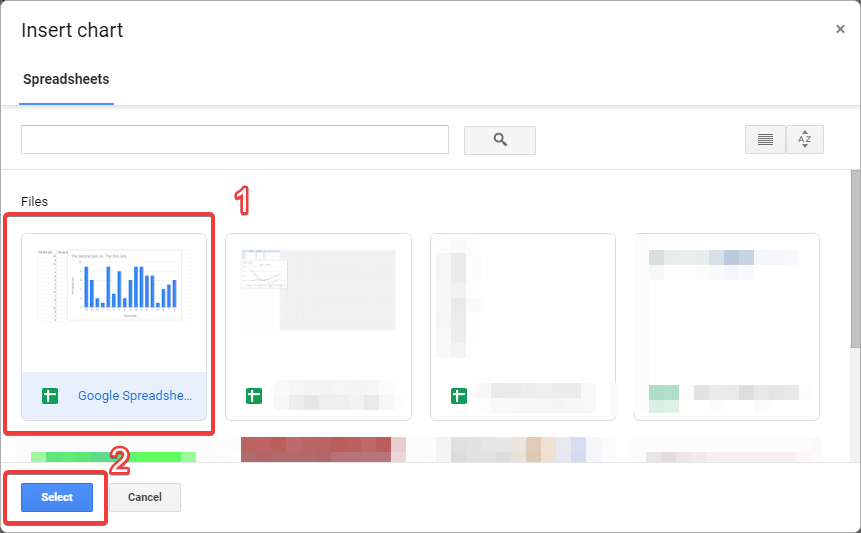
The “Insert chart” window will appear which contains all the graphs you’ve created lately in google sheets. Choose the one you want.
Step 4:
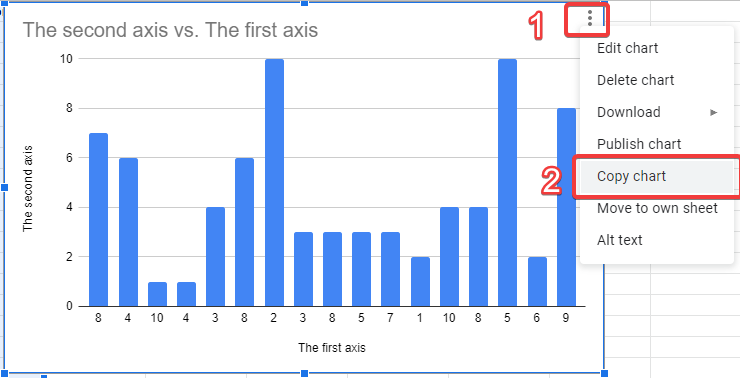
The second method is quite simple. Go to the graph in spreadsheets and click the three dots in the top-left corner of the graph. Then, click Copy chart
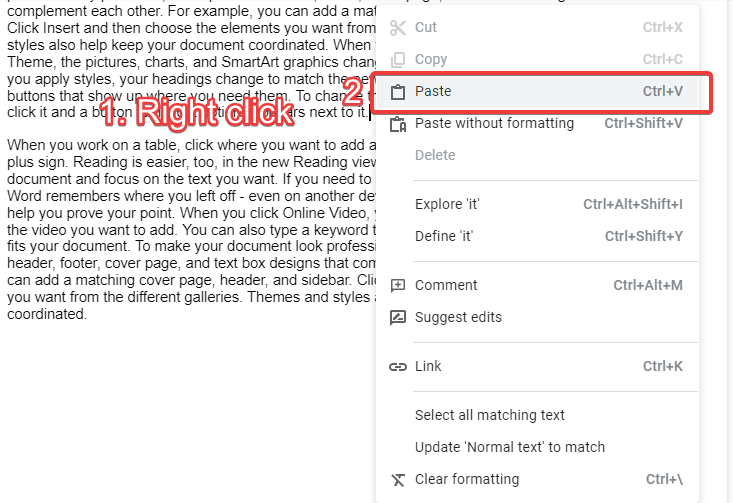
Step 5:
After that, go to the google docs document that you want to add the graph to. Place the mouse cursor where you want to add the graph and right-click. Then, click Past(also, you can just press ctrl + c and ctrl + v to copy and past).
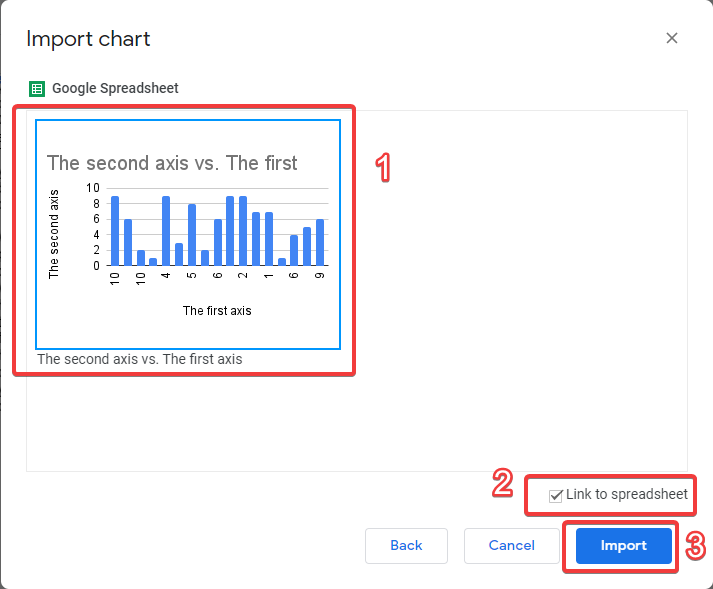
Step 6:
Finally, the “Paste chart” window will pop out asking you if you want to link the graph to the spreadsheet or not. Linking the graph to the spreadsheet is useful if you want to make changes to the data set as it allows you to update the graph automatically.
Conclusion
In Conclusion, google docs has many useful features such as the ability to add graphs to a document. Graphs are very important as they help you understand the data and explain it to an audience. In this article, you’ve learned how to make a graph on google docs. It is quite simple. First, create the data set in google sheets and make a graph from the toolbar. To do that, click Insert and then click Chart. After that, you can edit the graph and choose your favorite settings from the Edit chart window. Finally, you can copy the graph to google docs.
