
To Make a Pie Chart in Google Slides
- Open Google Slides.
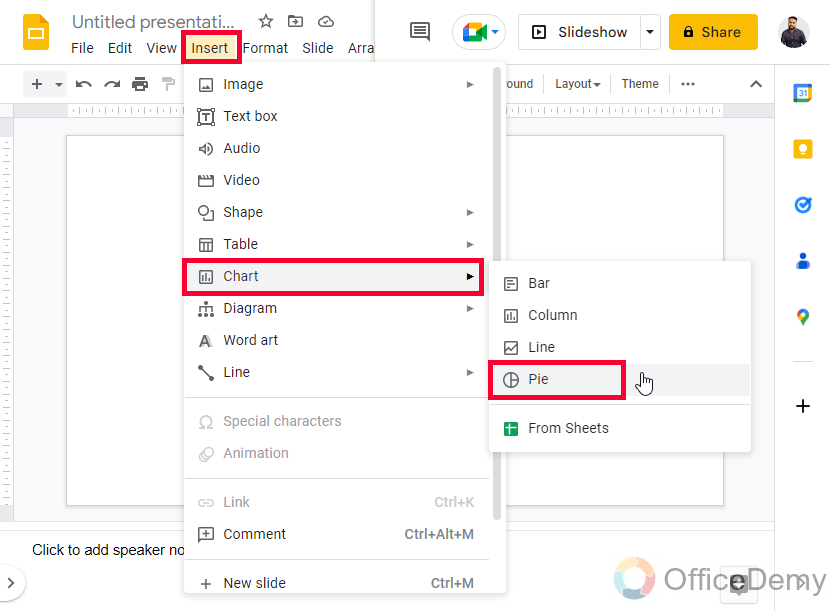
- Go to “Insert” > “Chart” > “Pie chart“.
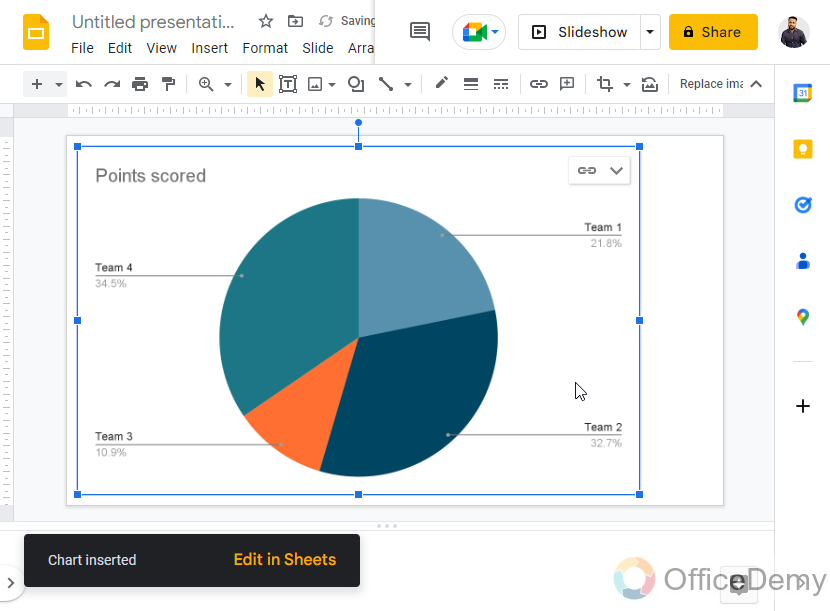
- A template with dummy data appears.
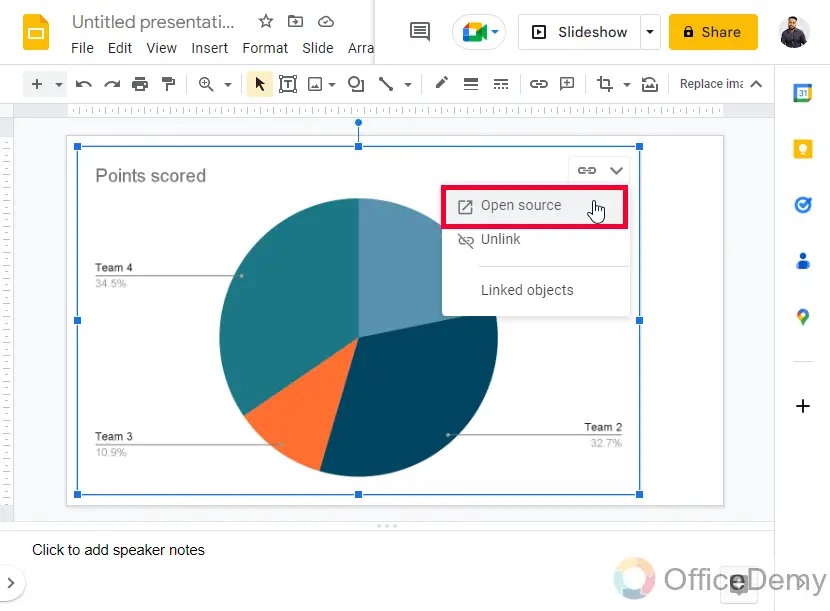
- Modify the chart data by clicking “Open Source” at the chart’s dropdown.
- Edit the data in Google Sheets, then click “Update” to reflect changes in your chart.
OR
- Go to “Insert” > “Chart” > “From Sheets“.
- Select a Google Sheets file that has a chart.
- Choose the chart you want to import.
- Optionally, check “Link to Spreadsheet” to keep it linked.
- Click “Import” to add the chart to your Google Slides.
OR
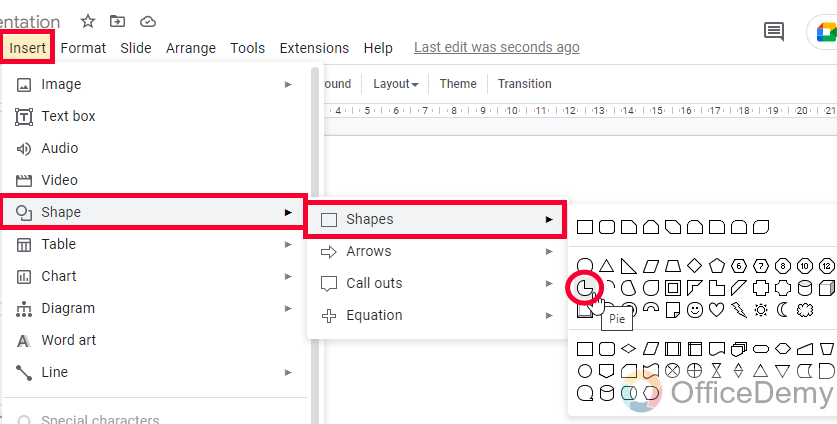
- Go to “Shapes” > “Shapes” > “Pie“.
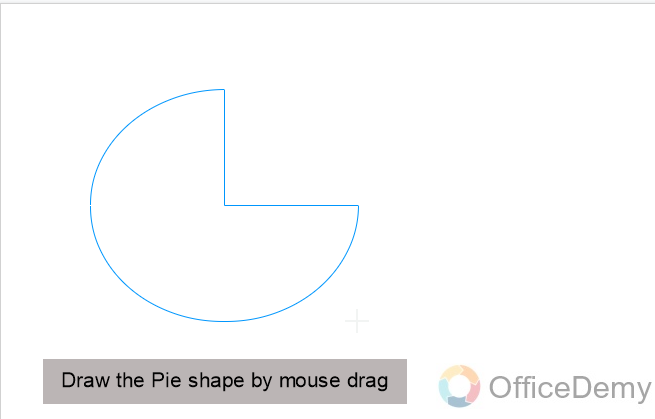
- Draw a pie shape.
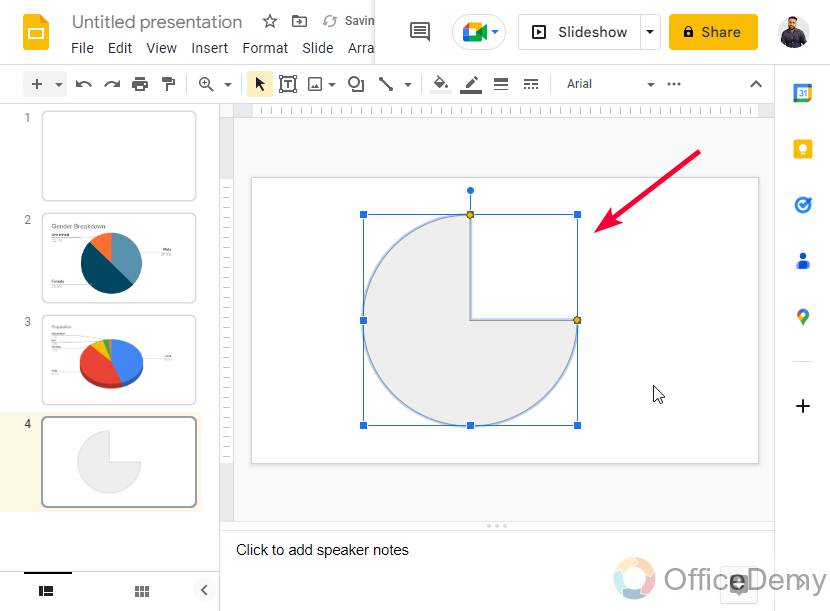
- Adjust the clipped area’s size by manipulating curves and anchor points.
- Customize the colors of each shape as desired.
Hi, today we will learn how to make a pie chart in Google Slides. As we have already covered how to make a pie chart in Google Sheets, Google Docs, and Google Data Studio by using built-in chart options, in this article we will see another method, a direct method to make a pie chart and a shape method to create a pie chart without any content inside. Sometimes, we need a pie chart with data and proper labels, while sometimes we just need a pie chart diagram without any data or labels, it is mainly used for printing purposes, making drawing books for kids, etc. So, we are going to learn both of these methods.
Pie charts are very useful when it comes to data distribution, there is no better way to display the categories and classes of the data than the pie chart. We can control the number of slices, the color of slices, the size of the overall chart, the intensity of the slice thickness, the opacity level, and so on. So, let’s move forward.
Importance of using a Pie Chart in Google Slides
Well, in Google Slides, we don’t have to worry about the pie charts because they are available within the chart list in the Insert section, we can easily make a pie chart using the direct methods, but what if we need to customize them, resize them, change data metrics for them. There is a simple method to make a chart, but making it useful and presentable is something that we should learn with concentration. So, I will show you the overall process from adding a chart to making it a perfect graphical representation of the data.
As we saw in Google Docs, Google Slides also provides an option to import a chart from Sheets. The method works identically to the Docs method, secondly, we can bring all the charts that are made in Sheets even if they don’t exist in the Slides.
Another notable thing is that we can easily control the data from a sample sheets file that is automatically created by Google Slides when we create a chart in Slides. We can add or remove data values, can change the number of dimensions and metrics. This is all we are going to learn in today’s article. That’s why we need to learn how to make a pie chart in Google Slides.
How to Make a Pie Chart in Google Slides
First, we will learn how to make a pie using the direct feature in the Insert tab, then we will see how to edit the charts data, then we will learn some customization features, and lastly, we will see how to make the chart linked to the original data, then we will learn how to add pre-made charts from Sheets, and then in the next section, we will learn how to make a pie chart in Google Slides using shapes. So, let’s get started.
How to Make a Pie Chart in Google Slides- Simple Approach
In this section, we will learn how to make a pie chart in Google Slides using the direct chart method. Here, we have a few chart templates available in Google Slides, unlike Sheets where we have so many. So, let’s see how it works, and we will set up the chart’s data.
Step 1
Open a Google Slides file from the home page, or start a blank presentation.

Step 2
Go to Insert > Chart > Pie chart
Step 3
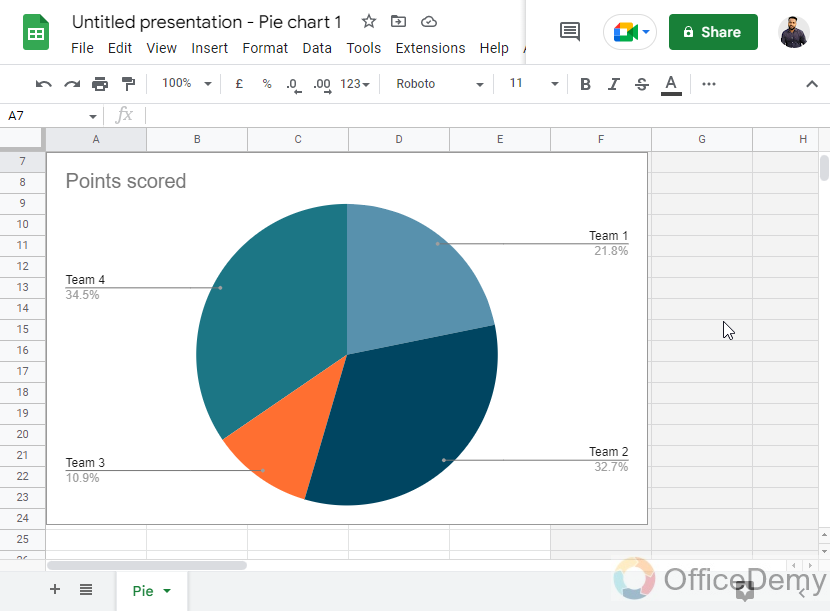
A template has been added with dummy data
This is how to make a pie chart in Google Slides very easily and quickly.
How to Make a Pie Chart in Google Slides – Modify Chart Data
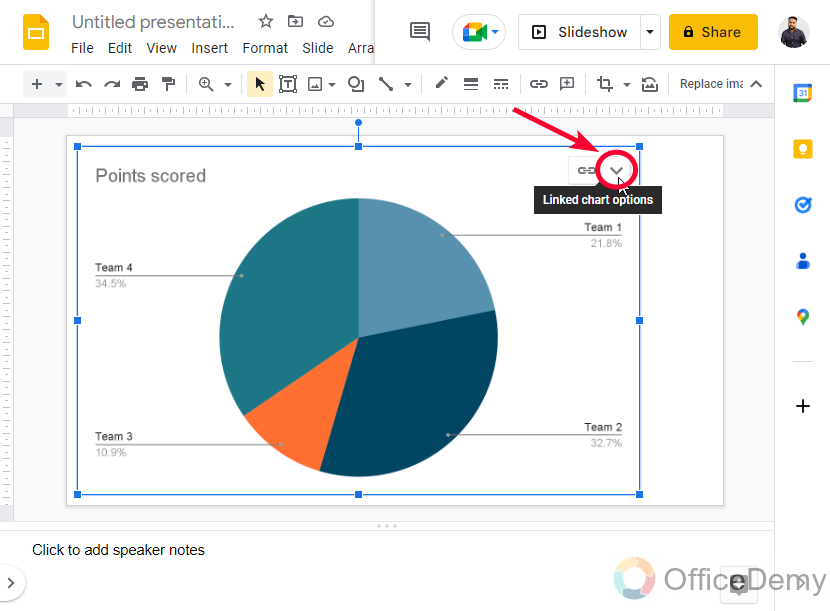
In this section, we will learn how to set up chart data after making a pie chart in Google Slides using the direct method. So, after you got the template, you have a dropdown at the top-right side of the chart in which you have an “Open source” option. Source means the data source. This is going to be a Sheets file in which dummy data is automatically placed by Google Slides.
Step 1
Click on the “Open Source” button in the chart’s dropdown
Step 2
A Sheets file opens in the new tab
Step 3
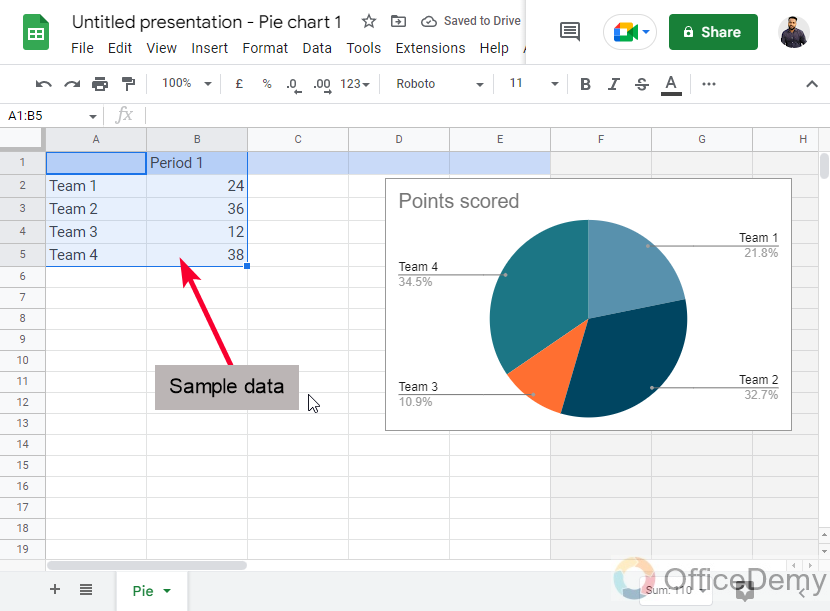
You can see here your dummy data that is visualized on your Pie chart, we can change the data here using basic Sheets skills, so let’s do it.
Step 4
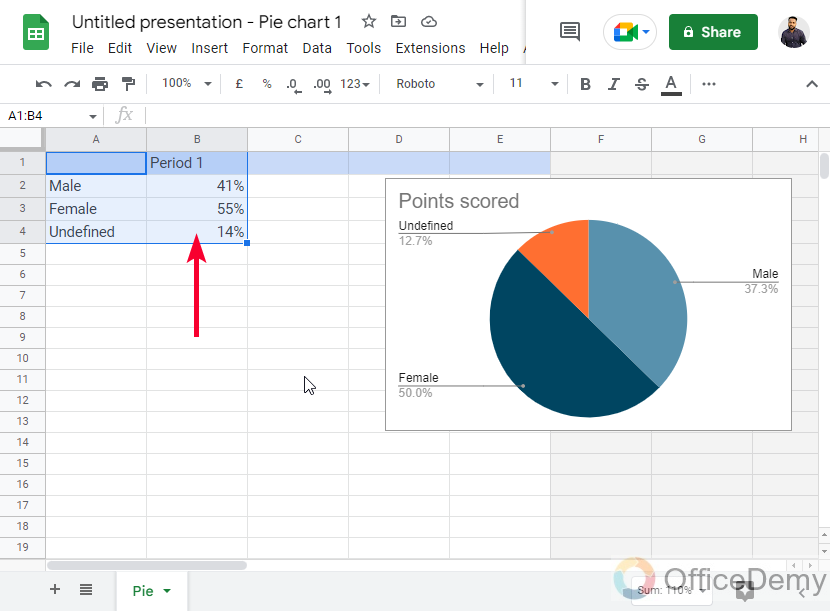
I have changed the data and made it look like a meaningful breakdown of the data.
Step 5
For your reference, the chart is also appearing on the Sheets file you can place it anywhere on the page to avoid any distraction when altering the data.
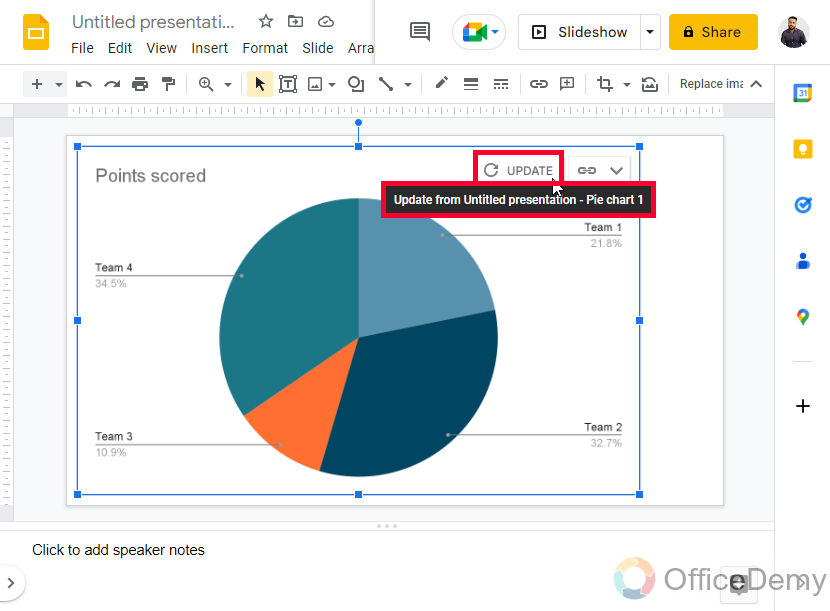
Step 6
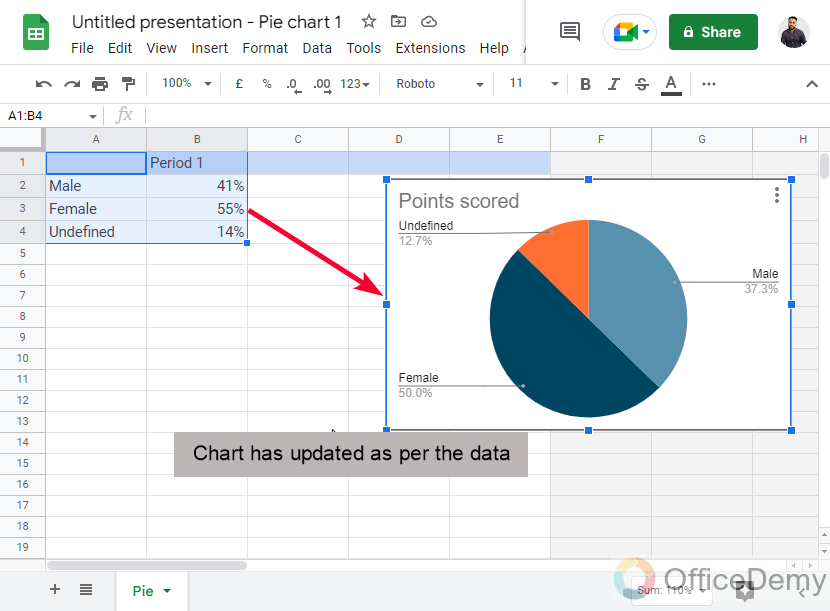
Now back to the Slides, you can see an “Update” button appearing on the top. Click on it to update the chart’s data
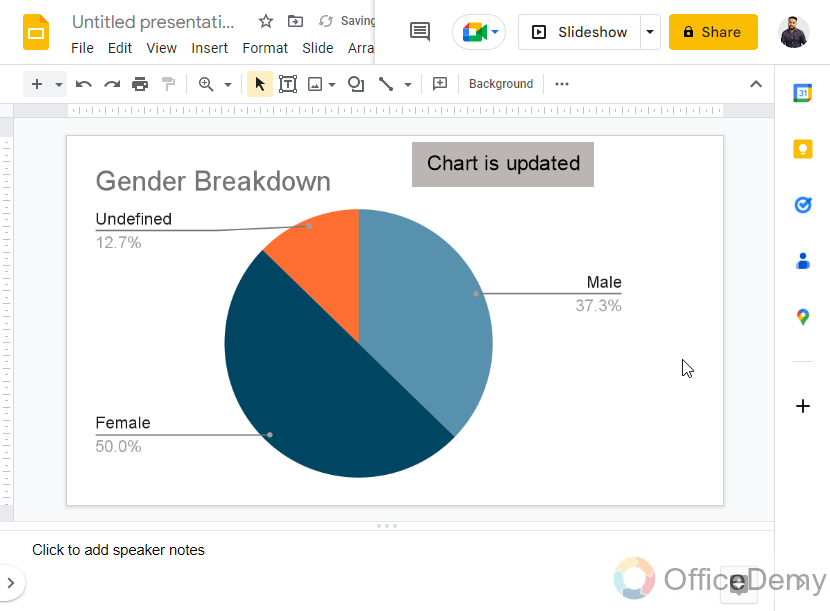
Step 7
The chart is updated. This is you do that.
This is how to make a pie chart in Google Slides, and set up the chart’s data very easily using Google Sheets.
How to Make a Pie Chart in Google Slides – Import a Pie chart from Sheets
In this section, we will learn how to make a pie chart in Google Slides and we will see how to import a pie chart from Google Sheets. If you are not that familiar with Google Slides but you have good command over Google Sheets, so you can use this method to first make your desired pie chart in Google Sheets and then import it into Google Slides.
So, for this example, I have a pre-made pie chart, and I will show you how to import it to Google Slides.
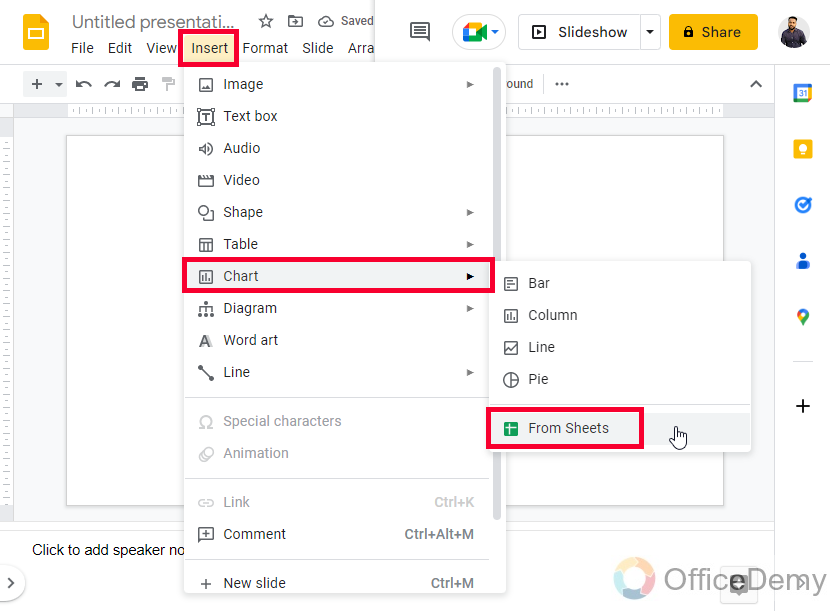
Step 1
Go to Insert > Chart > From Sheets
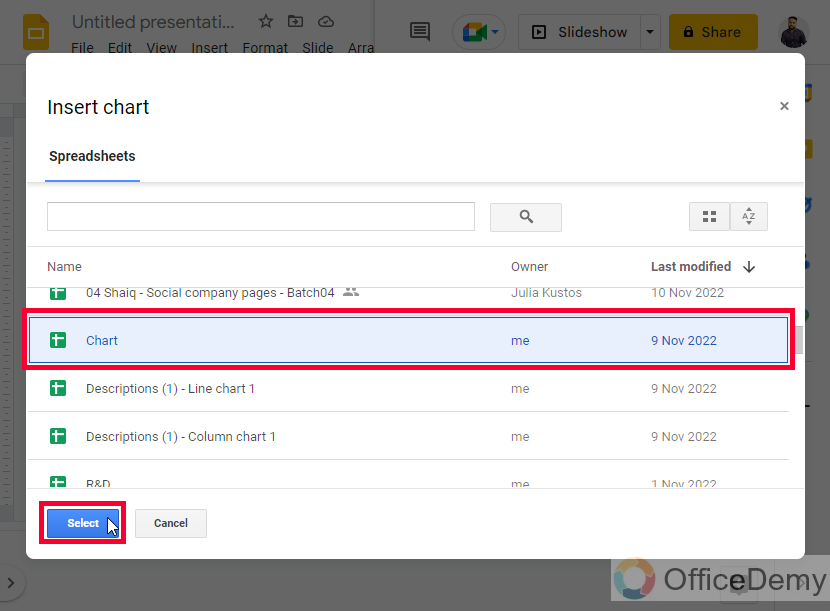
Step 2
A new pop-up window will appear, and it will have all the Sheets file that is present in your Google Drive
Select a file from the list and click on the Select button below
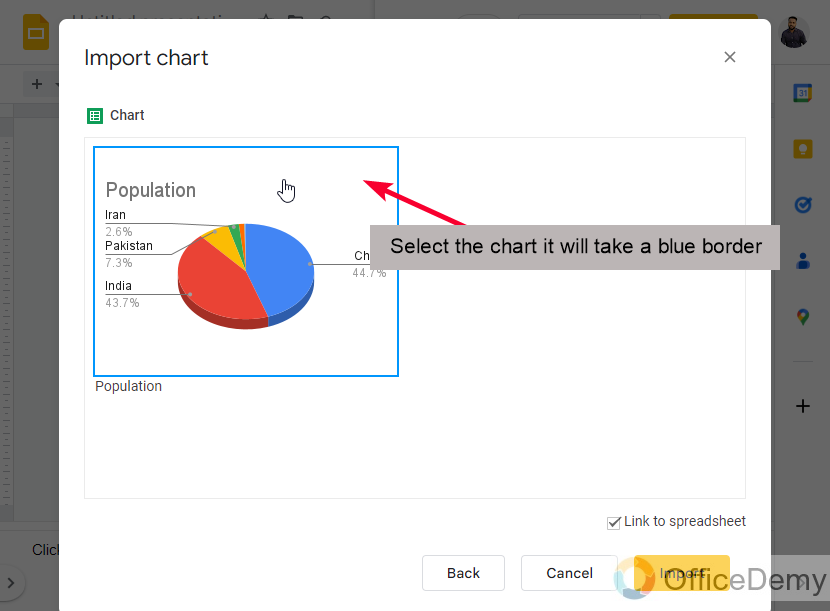
Step 3
On the next page, you will see the list of all the charts present in the selected file, click on any chart to select it.
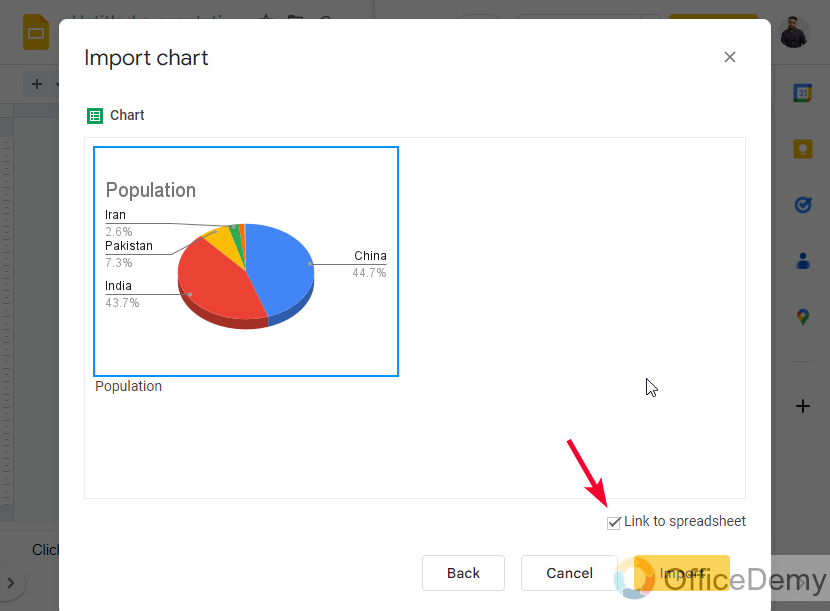
Step 4
An important checkbox “Link to Spreadsheet” on the bottom right side, is to tell Slides to keep this file linked and make real-time changes in the chart. You can check this checkbox to keep the spreadsheet linked.
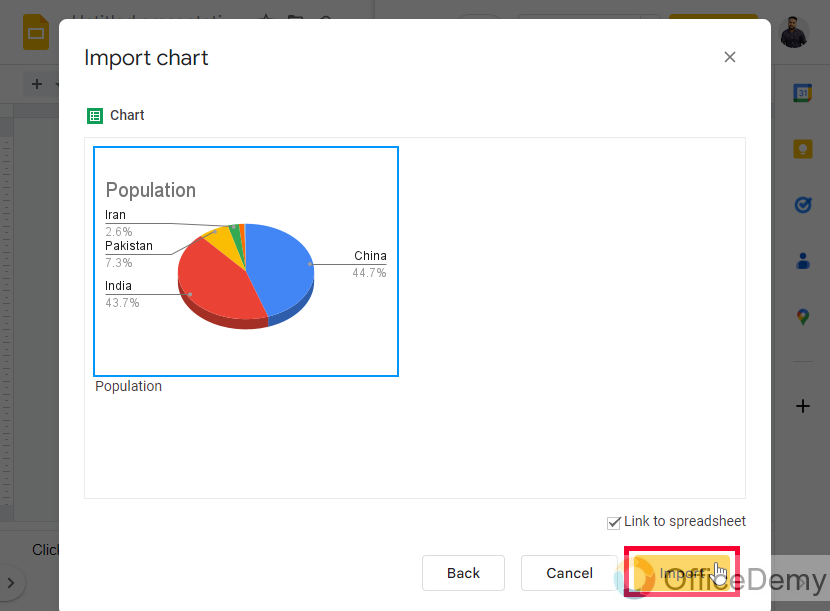
Step 5
Click on the import button to continue
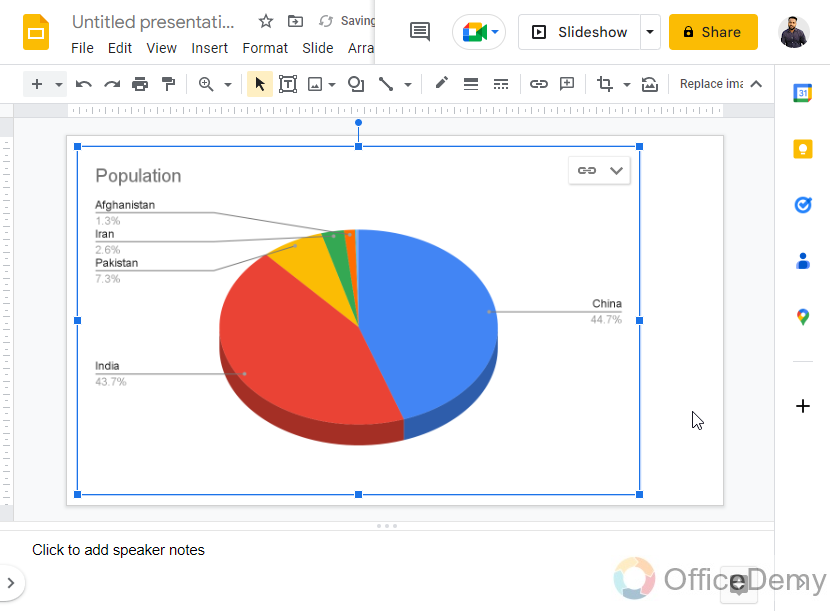
Step 6
The chart has been added to your Slides from your Sheets file.
This is how to make a pie chart in Google Slides, and we learned how to import a pie chart from Google Sheets.
How to Make a Pie Chart in Google Slides – Using Shapes
In this section, we will learn how to make a pie chart in Google Slides using shapes. We sometimes don’t need a data chart, we just need an empty pie chart template that can be used for printing purposes, or whatever your requirement is. Note that these charts do not contain any data or labels, so there is no logic for colors, and the number of slices, all the work is fully manual and we have to draw the segment between the slices. Let’s see how it works.
Step 1
Go to Shapes > Shapes > Pie
Step 2
Draw the Pie on your Slide
Step 3
Now you can see there is a space from where the slice is clipped, you can keep it as it is if you want, or you can increase or decrease the size of the clipped area by using the curves handle and anchor points on the edges.
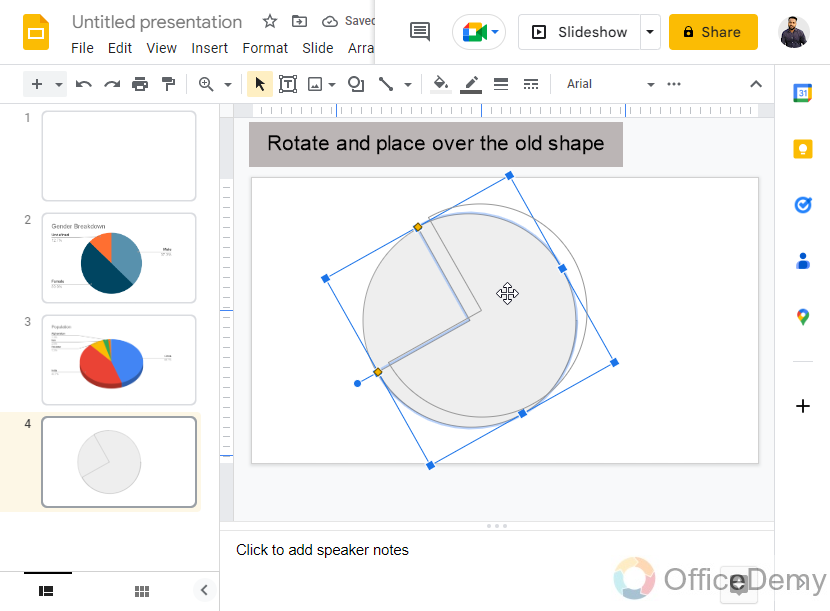
Step 4
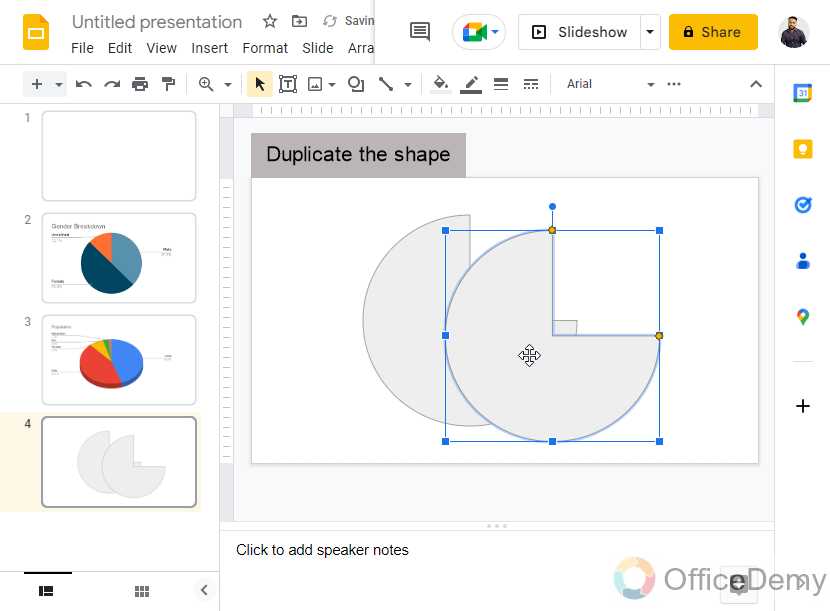
For any means, if you want to add another slice to fill this gap, you can copy the overall shape > paste it, and then rotate it to mirror the old shape
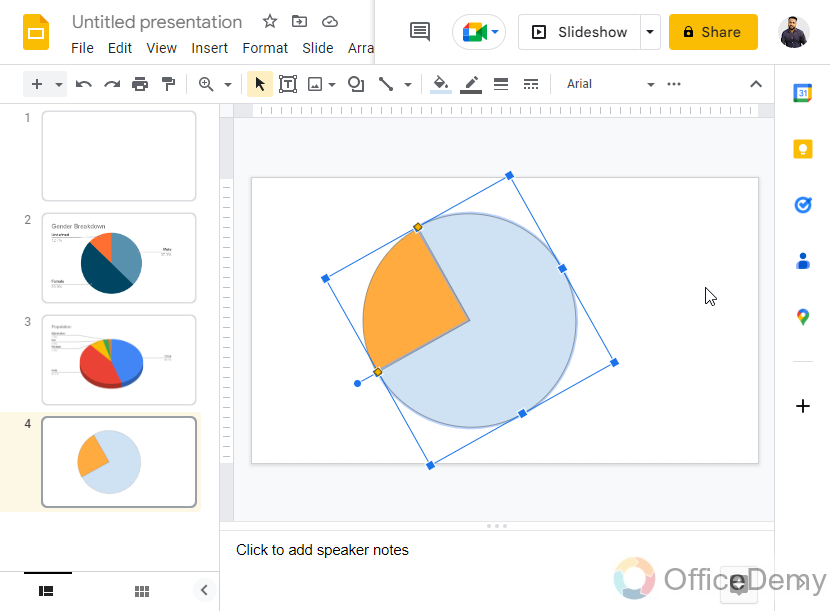
Step 5
Now you can change the color of any of the shapes you want to show with another color.
This is how to make a pie chart in Google Slides using shapes. These types of shapes are mostly used to make kids’ drawing books, question papers for kids, and so on.
Important Notes
- Pie charts are directly available in the chart list in Google Slides.
- Pie charts can be customized in Slides as an image, but not as a chart.
- If you want to use the chart customization features in a chart of Google Slides, it’s recommended to create it on Sheets and then import it to Slides.
- When we make Pie charts using shapes, then they are not “charts” technically they are only shapes that can be used for any purpose but not to visualize data digitally.
Frequently Asked Questions
Can I Insert a Pie Chart in Google Slides Using the Same Steps as Inserting a Drawing?
Yes, you can insert a pie chart in Google Slides using the same steps as adding drawings in google slides. Simply go to the Insert menu and select Chart. From there, choose the pie chart option, and you can customize it to suit your needs.
How to make a pie chart of multiple slices in Google Slides?
We can use shapes, in the shapes, we have a pie shape which is a clipped pie, we can further crop it to make the desired shape for us, and then to add more slices we can add more customized pie shapes with different colors.
How to change the slice color of the pie chart in Google Slides?
There is no direct method to change any colors in the pie charts within Google Slides. But an easy and only method is to edit the colors of the charts in the Sheets. When you open the source of the chart, a sheets file is opened in the new tab that is associated with your Slides file, you can then double-click on the chart in the Sheets file to change the color of any element inside the chart.
Conclusion
Wrapping up how to make a pie chart in Google Slides. I tried to cover almost every method to create or import a pie chart in Google Slides. There are various methods to use in various situations. You can use any of the methods that suit your requirement. I hope you find this tutorial helpful. I will see you with another useful guide. Till then take care, keep learning with Office demy.

