
To Make a Pie Chart on Google Forms
- Go to the “Responses Summary“.
- Click on the Google Sheets icon to create a spreadsheet of the responses.
- Create a table for the option titles and count the number of responses for each preference using the COUNTIF formula.
- Make a chart of the table.
- Choose “Pie Chart” from the Chart Editor Chart Types.
- Customize your chart as needed.
Google Forms enable us to take surveys, questionnaires and quizzes online without much effort. It also provides us with analytical services. We need not to make summary and reports by ourselves, rather Google Forms make them for us automatically. In this article, we will demonstrate how to make a pie chart on Google Forms.
What is Pie Chart?
Pie chart is a type of chart that presents data in a very well structured manner. It is a simple graph where a circle is divided in different sectors. Each sector represents a part of the whole data or information. Pie charts are made for quantitative data where we have a quantity in numbers. Sectors are represented with different colors for more visibility.
Why do we make pie chart on Google Forms?
Any survey or form is made in order to analyze something. Once we have received desired amount of responses, we need to move on to make a summary of the responses. Google Form does this for us automatically. Just as new responses are added to form, Google Forms automatically add them to the summary of responses. For Multiple Choice Questions, the summary is already in Pie Chart format. In case of Multiple Choice Grid, the summary is in column chart.
Let us demonstrate where we can get Pie Chart of Multiple Choice questions and how to make a pie chart for other questions where we do not get a pie chart as summary by default in this article.
How to Make a Pie Chart on Google Forms?
Let us consider a simple scenario where we are going to organize a survey to determine the public’s view on “Effects of Online Exams”. In this scenario, we will determine public’s view on online examinations and their effects. Using this scenario in Google Forms, we will create a survey. And then we will demonstrate how to make a pie chart in Google Form using this scenario.
Create a Google Form
Let us create a new Google Form to demonstrate pie chart. Follow the steps below for the creation of a new Google Form.
Step 1: Go to “Google Forms” website.
Step 2: Click on “Go to Forms”.
On the google forms website, click on “go to forms” as:

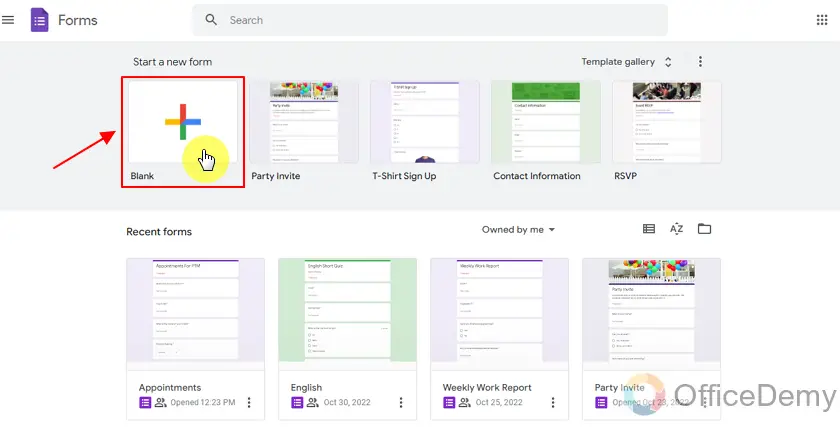
Step 3: Choose a template.
List of templates will be shown to choose from. Here, you can select one of the pre-made google forms or click on “blank” to create a new blank google form. We will choose blank form for demonstration as:
Add title to the Google Form
Just as you choose the template, a new Google Form is created. Now, you can add title to the Google Form as per requirements. You can change or add title of the form by clicking on the title as:
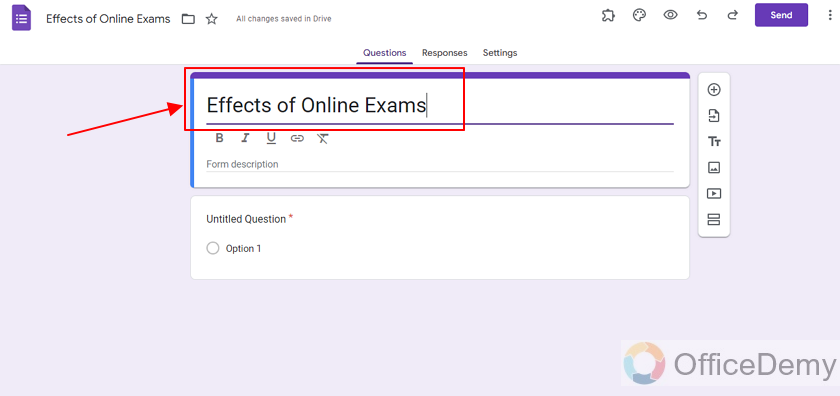
As we chose the topic “Effects of Online Examination”, we have used it for the title as well as shown in above screenshot.
Add description to the Google Form
Step 1: Click on the description as:
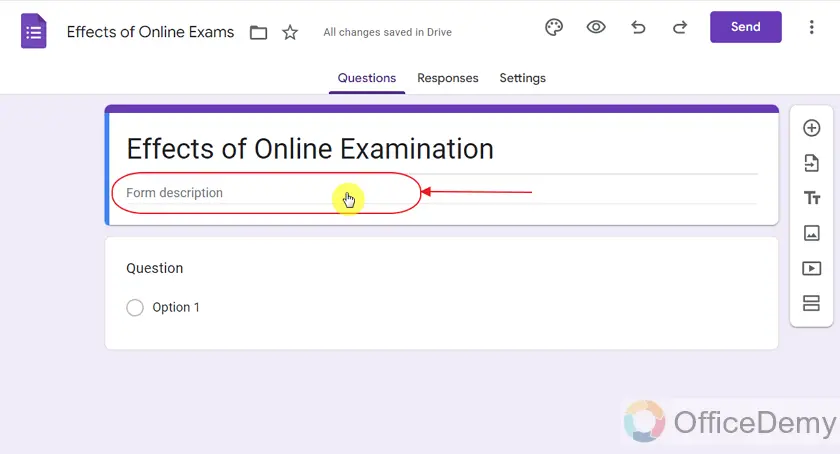
Step 2: Type-in the description.
Here, we have inserted the description as:
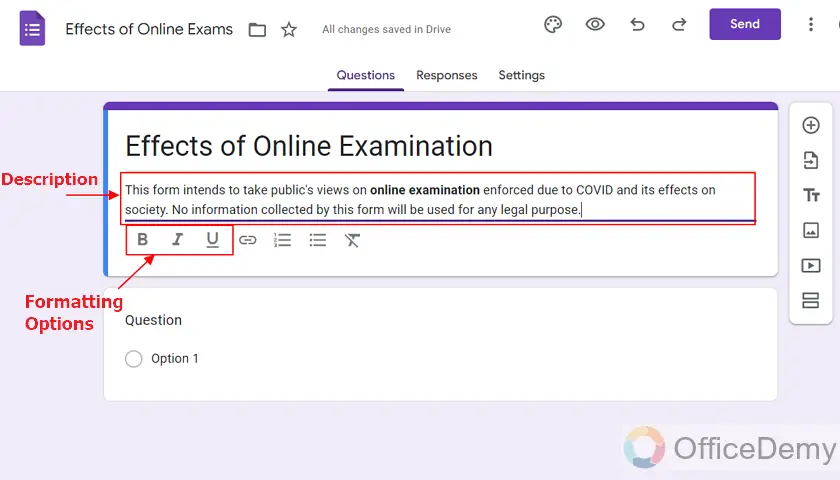
Also, you can the formatting options above. They can be used to enhance the formatting of text of description.
Make Multiple Choice question in the Google Form
Step 1: Label the question.
We will start off by labelling the question as:
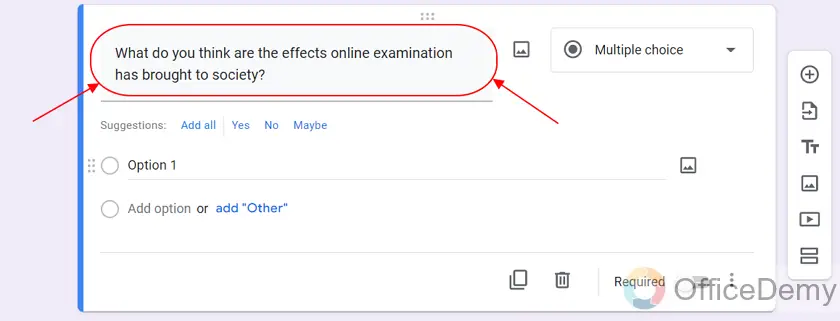
We see that the question by default is the Multiple Choice so there is no need to change the question type.
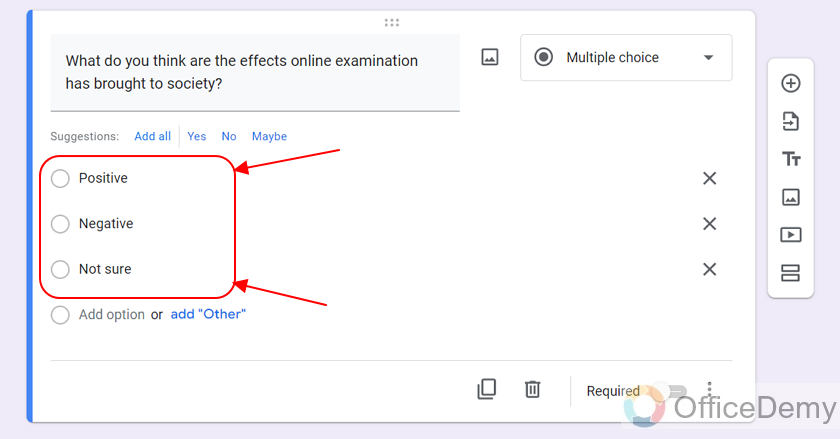
Step 2: Add the options.
Now, we will add the options as:
Make Short answer question in the Google Form
Step 1: Add a new question.
We will add a new question by clicking the + icon as:
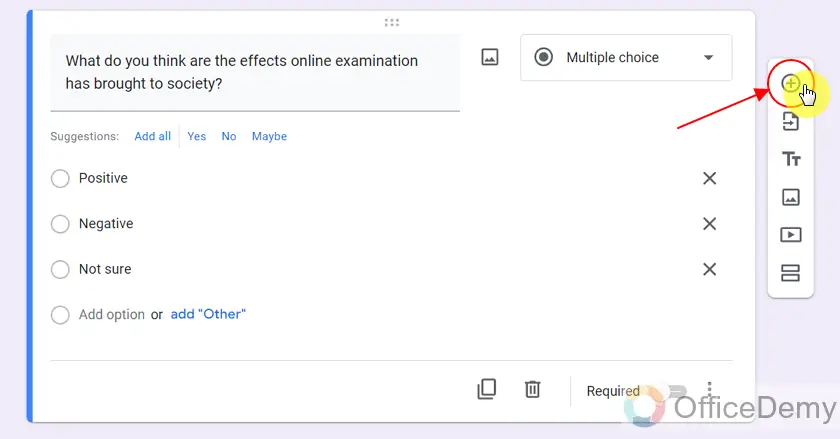
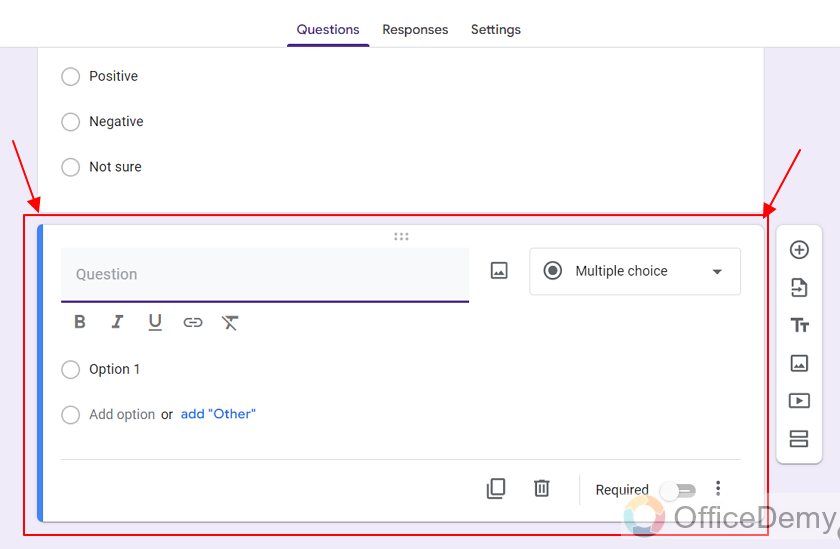
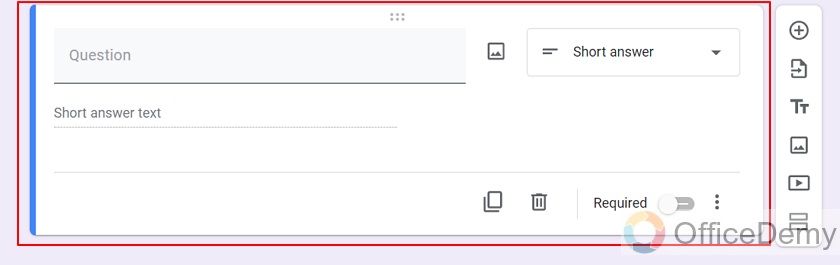
We can see a new question appears as:
Step 2: Change the question type to “Short Answer”.
We can choose the “Short Answer” type from the question type as:

A short answer question appears as:
Step 3: Add the question title.
We have entered the question title according to our scenario as:

Make ranking question in the Google Form
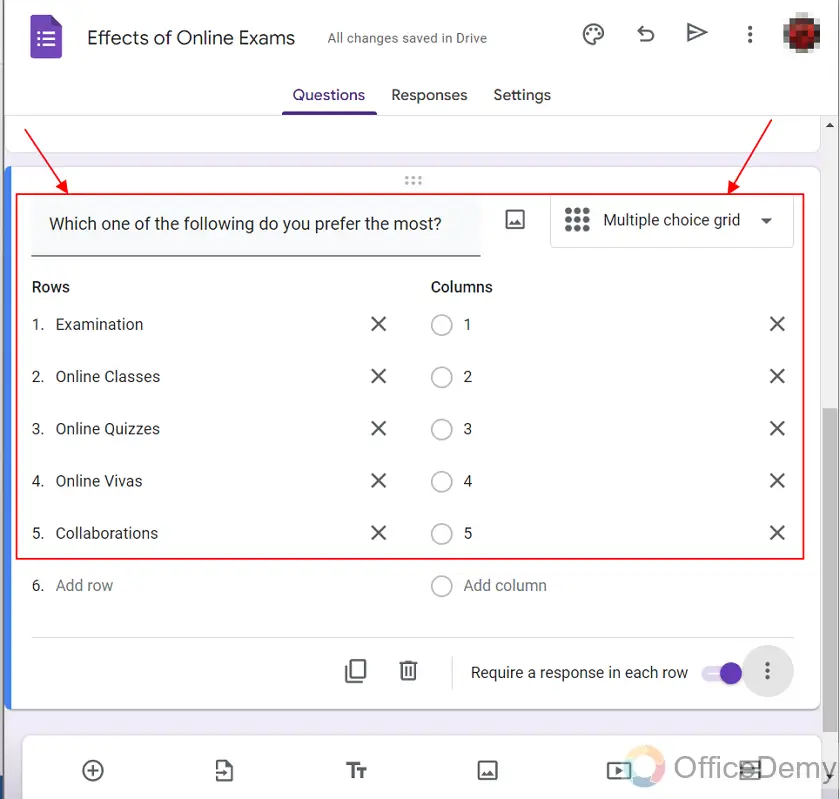
We have also added another question in the form according to our scenario as:
In order to learn more on how to make a ranking question in Google Form, please view our article on How to do ranking in Google Forms.
View Responses Summary in Google Forms
When we have received enough responses, let us move on to the demonstration of pie chart in google form. In this case, we have received 6 responses yet as it is shown in the screenshot below:
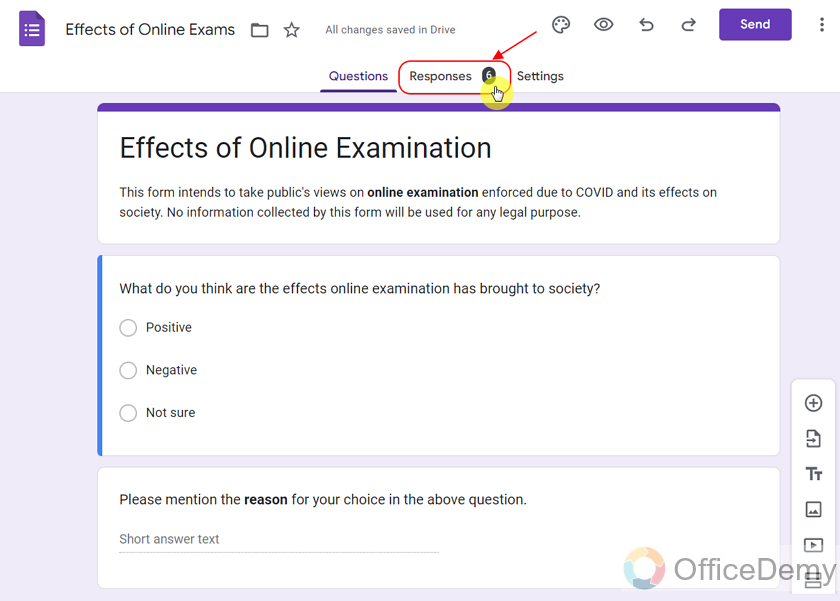
We will simply click on the “Responses” tab to view responses. We can see responses summary as:


Pie Chart for Multiple Choice question in Google Form
As you can see in the above screenshots, Multiple Choice question type has the summary as a Pie Chart by default in Google Forms. You can copy the pie chart by clicking on the Copy button as:

Pie Chart for Short Answer question in Google Form
As the name suggests, short answer question enables the responder to type his thoughts on the matter in a sentence format, so there is no way to make its pie chart.
Create Table for Pie Chart for Multiple Choice Grid (Ranking) question in Google Form using Google Sheets
As we see in the above screenshots, Multiple Choice Grid or Ranking questions has the summary as a Column Chart by default in Google Forms. As multiple responses for multiple rows exist in the form of grid. We can create Pie Charts on the basis on its responses for each row using the process below:
Step 1: Go to “Responses Summary”.
Step 2: Make spreadsheet of the responses.
Click on the google sheets icon in responses tab as shown below:

You can select your destination and click on “create” as:

Now you can see your google sheets storing all the responses as:
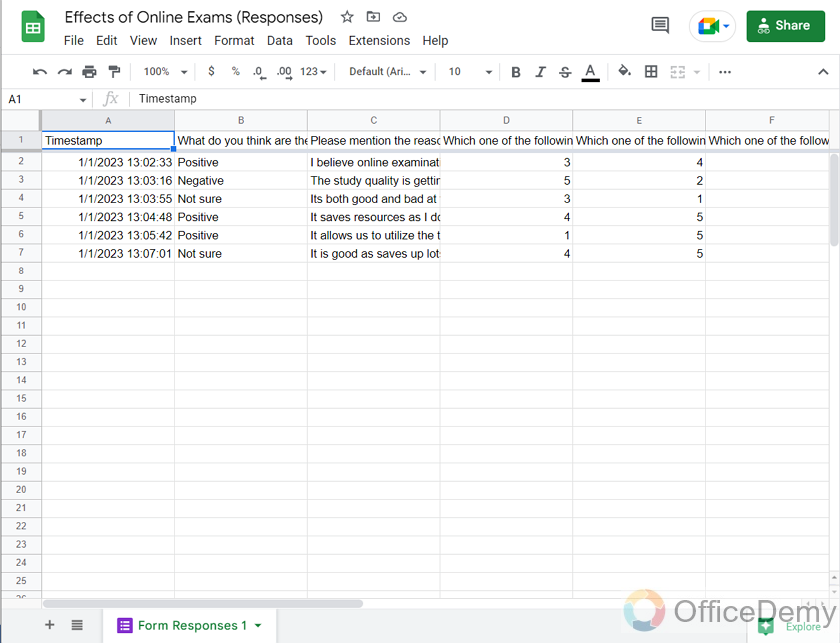
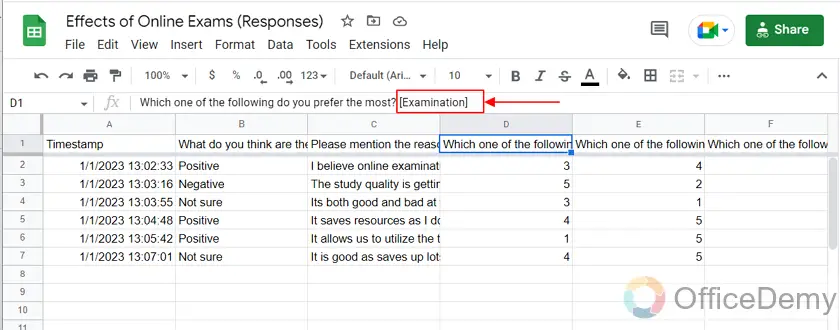
Step 3: Make table for option title.
Once the spreadsheet is ready, we can see the option titles of the Multiple Choice Grid as:
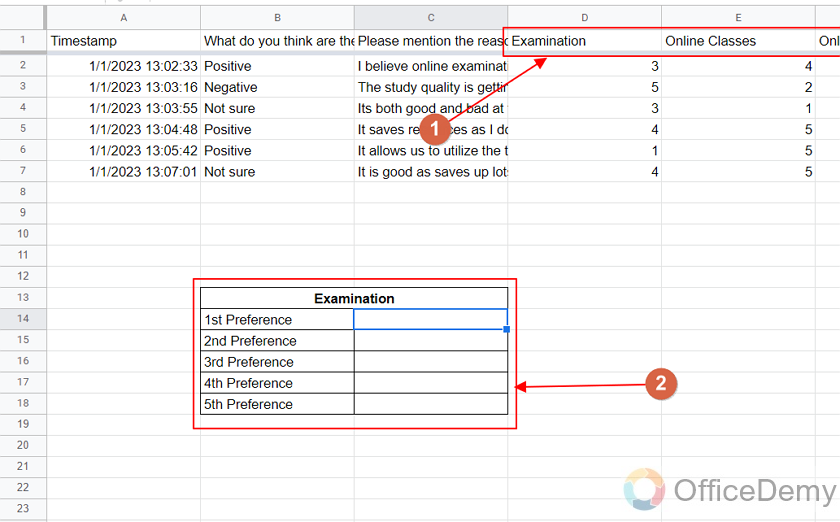
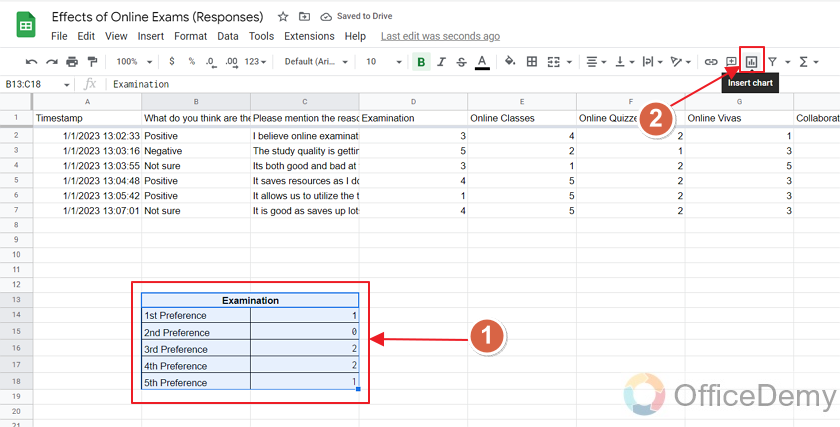
We will rename column names as per the option titles for our understanding. Also, we will make a table to count the number of responses for each preference as:
Next, we will use the COUNTIF formula in Google Sheets to count the number of occurrences of 1 in the responses as:
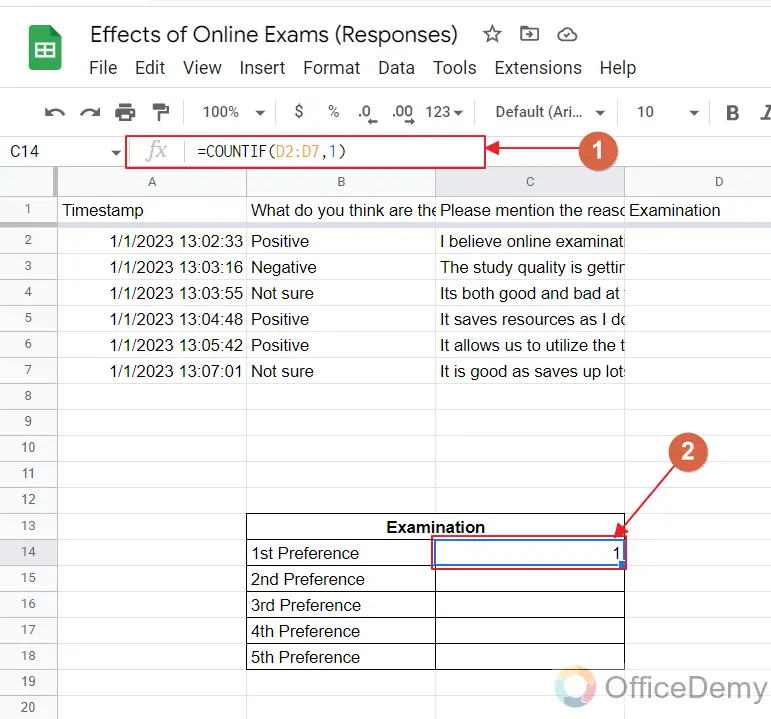
In order to learn more about COUNIF formula in Google Sheets, please read our article on How to use COUNTIF in Google Sheets.
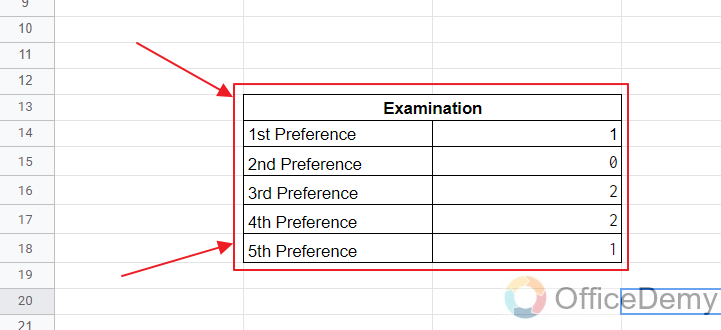
Now, we will do the same for other options as well.
Pie Chart for Multiple Choice Grid (Ranking) question in Google Form using Google Sheets
Once the table is complete for one option title, in this case, Examination, we can now proceed to make Pie Chart for preference of responders on Examinations.
Step 1: Make “Chart” of the newly created table.
Firstly, select the table and create chart by clicking on the chart icon as:
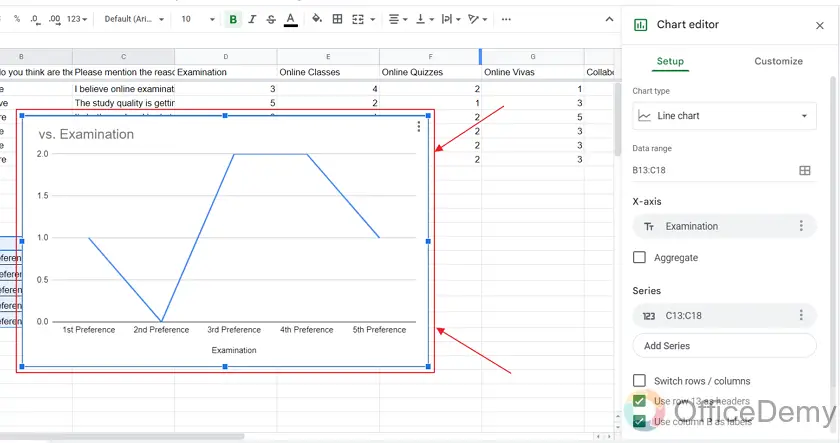
We can see the chart along with the chart editor as:
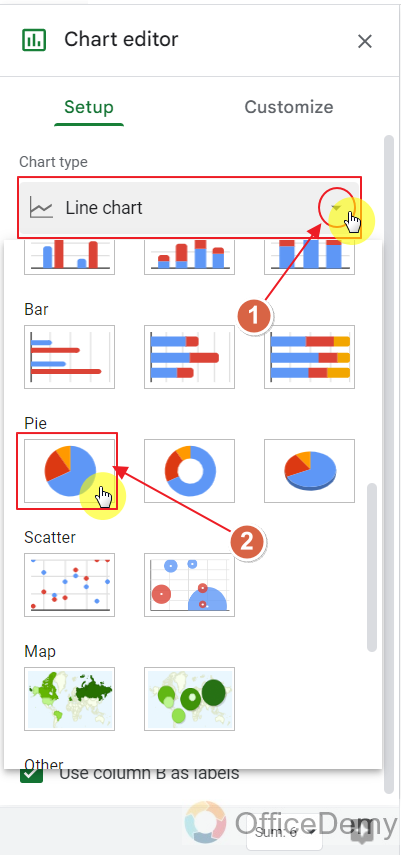
Step 2: Choose “Pie Chart” from Chart Editor Chart Types.
Just as we click on Pie Chart, we can see the required Pie Chart for Examination as:
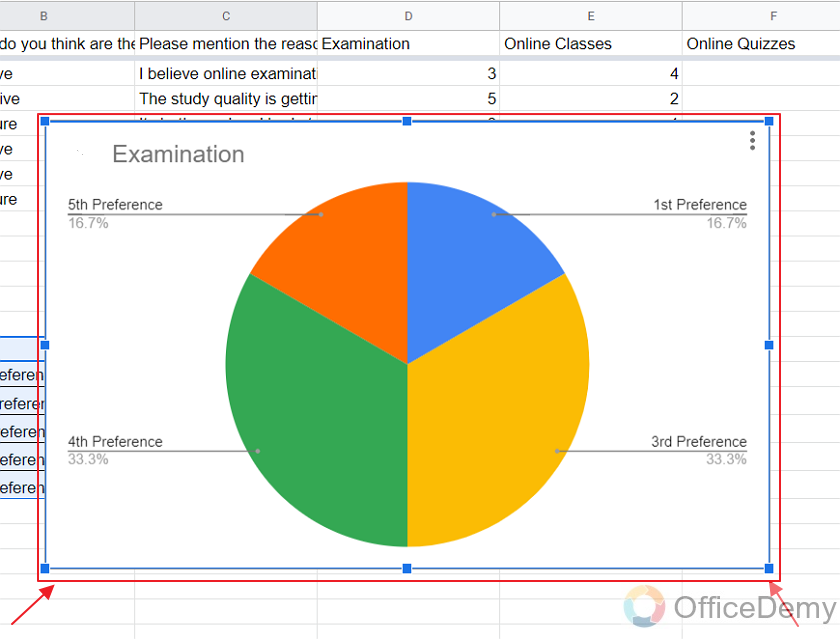
In the same way, we can make Pie Charts for any other option in Ranking Question.
You can also customize your chart or select a different design by given options in Chart Editor.
Important Notes
- We must have access rights over the specific Google Form to view responses and summary.
- We cannot make Pie Chart for Short or Long answer question types as each answer will be in the form of paragraph or sentences exclusively written by responder.
- Multiple Choice Question’s response summary is made using a Pie Chart by default.
- We can also make Pie Chart for ranking questions in Google Forms using the above given procedure.
Frequently Asked Questions
What is the default summary format of Multiple Choice questions in Google Forms?
Default response summary for Multiple Choice question is automatically generated as a Pie Chart in Google Forms.
Can we make Pie Chart for Short Answer question in Google Forms?
No, it is not possible to make a meaningful Pie Chart of Short Answer question in Google Forms as each answer is a unique one.
Can I Use Google Data Studio to Make a Pie Chart in Google Forms?
Yes, you can use Google Data Studio for customizing pie charts in Google Forms. With this feature, you can easily create visually appealing and interactive pie charts that enhance the presentation of your form responses. Customizing pie charts in google data studio allows you to personalize the chart’s colors, labels, and other visual elements to suit your preferences or brand identity.
Can I Use the Same Method to Make a Pie Chart in Google Sheets and Google Forms?
When it comes to creating pie charts with google sheets, you can easily use the same method in Google Forms as well. Both platforms offer a user-friendly interface and tools to generate visually appealing pie charts. So, whether you are working with Sheets or Forms, the process of creating pie charts with Google is simple and efficient.
Can we make Pie Chart for Multiple Choice Grid or ranking question in Google Forms?
With the help of Google Sheets, we can make Pie Chart of Ranking questions for Google Forms. The process for making a pie chart for ranking question is demonstrated in the above article.
Conclusion
In this article, we discussed about the responses summary of various types of questions in Google Forms. We noticed that Multiple Choice questions’ summary is already made as a Pie Chart and also discussed how to make Pie Chart of the Multiple Choice Grid (or simply Ranking) question in Google Forms with the help of Google Sheets.
Thanks for reading!