
To Make a Table in Google Sheets
- Input your tabular data.
- Optionally, format your table by setting headings with font-weight: bold, font-size: 12px, text-align: center, vertical-align: middle, and adding background colors.
- Format the entire table by setting text-align: center, vertical-align: middle, and adding borders.
OR
Make a Pivot Table:
- Input your data.
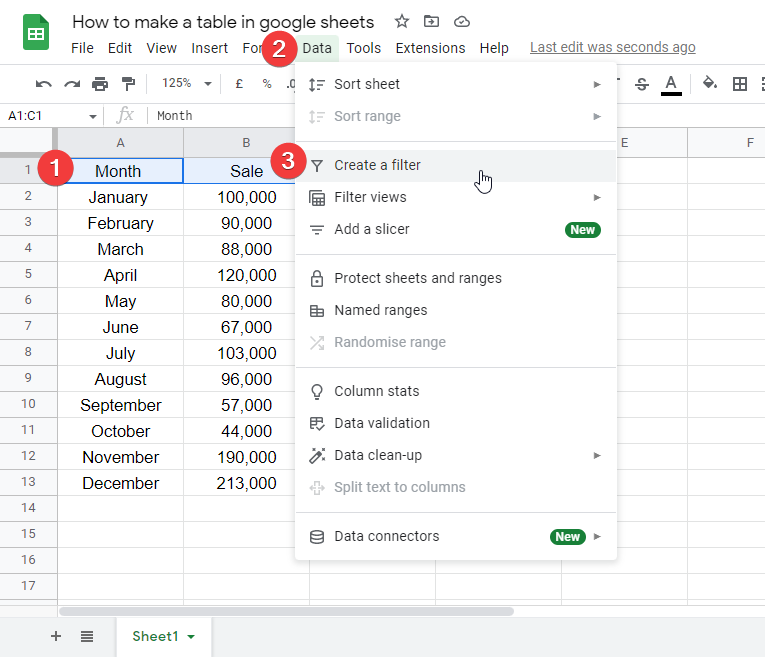
- Create filters on column headers by going to Data.
- Create filter.
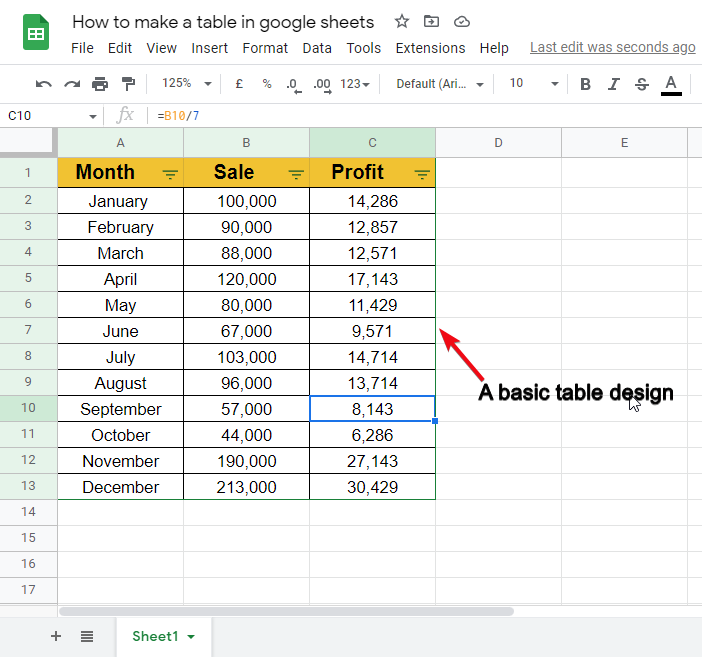
- Format your table for design purposes.
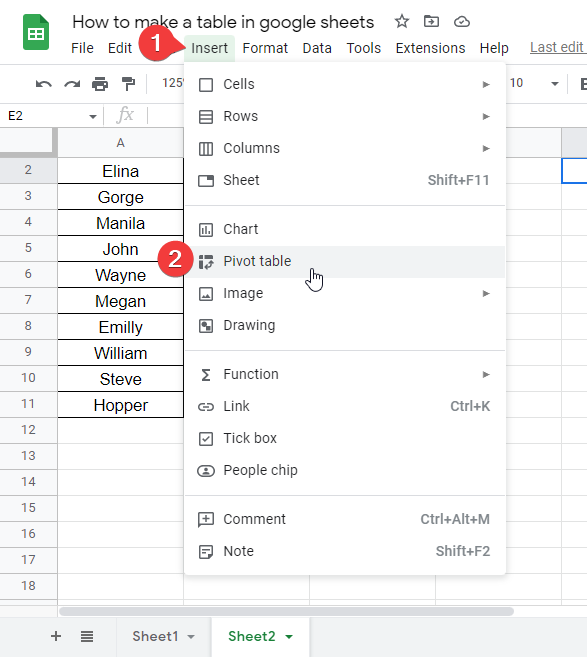
- Go to Insert > Pivot table.
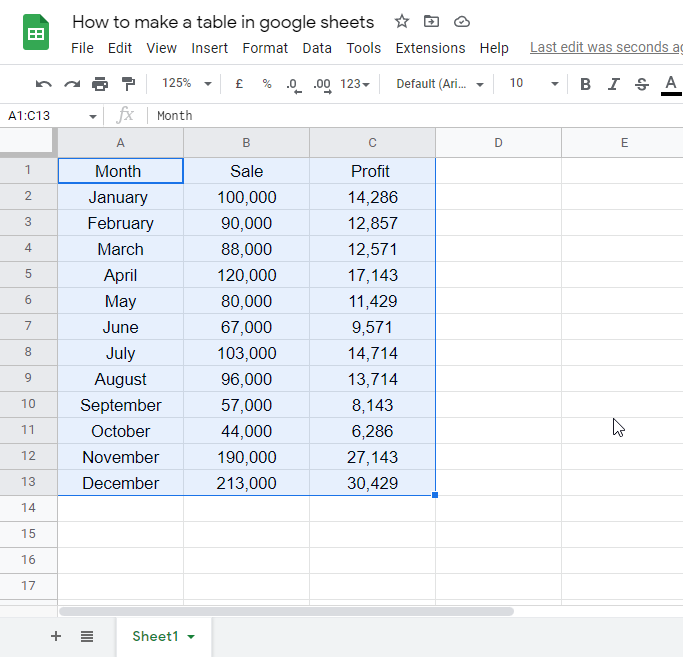
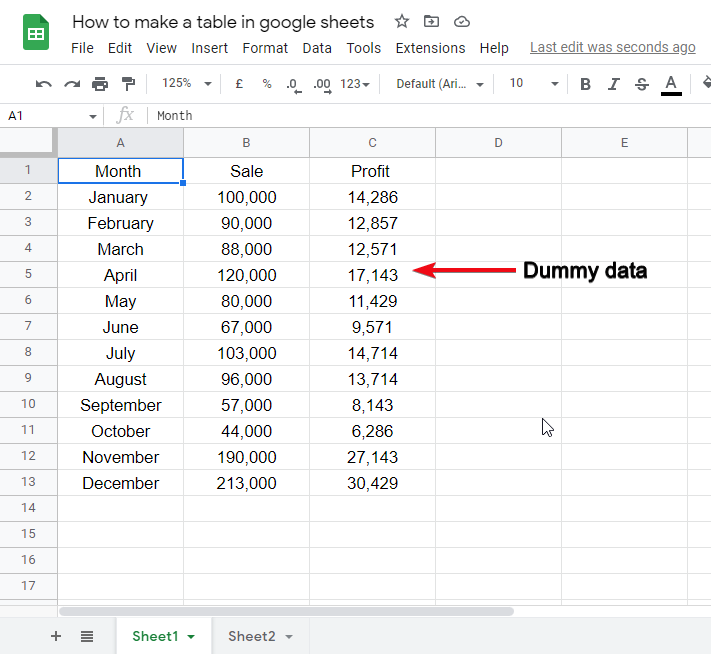
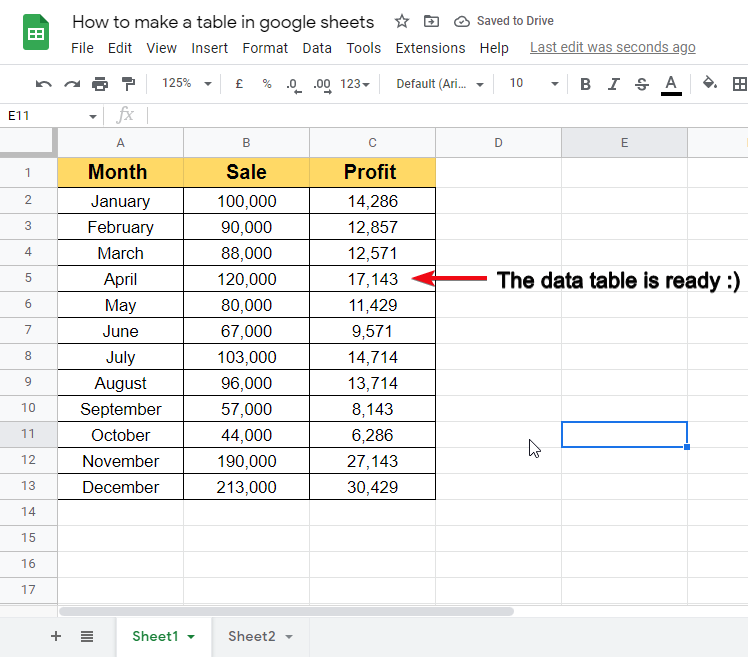
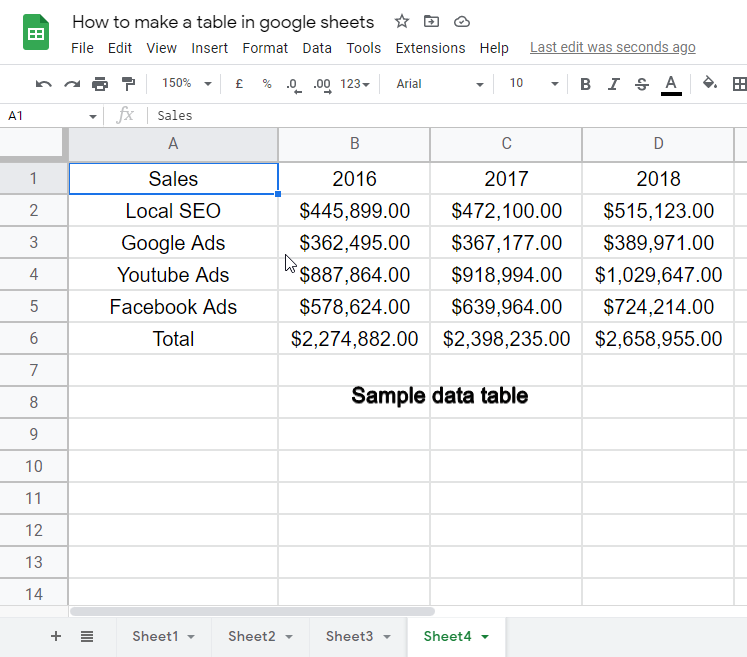
Today we are going to learn, how to make a table in google sheets, tables are very important and helpful to deliver the tabular data, they also help us to categorize our data and present it in a good understandable format. In google sheets, we have an option to create a table directly and that is a pivot table, Pivot tables provide extra functionalities for tables, for calculating, getting averages, sorting, and many other functions making pivot tables very adaptable and usable. If you create a table in google sheets, simply put your data in a tabular form such as shown in the image below.
You can transform the same data into a pivot table and we will guide you on how.
Advantages of Making a Table in Google Sheets
As we all know that tables are highly presentable and self-explanatory, tables contain different that can be understood and analyzed very quickly as compared to the plain data. This is why tables are highly used in data presentation and visualization. We also interact with so many tables daily when we study using the internet, we have study materials and books that contain tables, so this is something that is most commonly used and also helps us convey our point and user understand it very easily in a lesser time.
How to Make a Table in Google Sheets
Google sheets provide a default interface with all cells spread all over the workspace. We can add headers, color some important cells, and border our data to make it look like a table, but is this enough? do we need some more functionalities and design needs in the tables? yes, we need it. That’s why pivot tables came to the mark. Pivot tables are relatively new but getting popularity very quickly, pivot table is also a table with many default functions and features that help us perform our table-related calculations and tasks in minutes. We will teach you how to make a simple table, and how to make a pivot table as well.
How to Make a Pivot Table in Google Sheets
Firstly, we will need to set up our data to transform that data into a newly created pivot table, pivot tables are more for the representation, calculations, analysis, and better visualizations, we will first create a raw table and then transform it into a pivot table.
Step 1:
Enter your tabular data or sample data
Step 2:
Create filters on column headers. Go to data > create the filter
Step 3: (Optional)
Design your table
Step 4:
Go to insert > Pivot table
How to Make a Data Table in Google Sheets
A simple data table can be made in google sheets easily keeping some basics in mind. In this section we will teach you the fundamentals of making a data table in google sheets, so open your google sheets file and follow this article and make a great data table.
Step 1:
Write your data in rows and columns
Step 2:
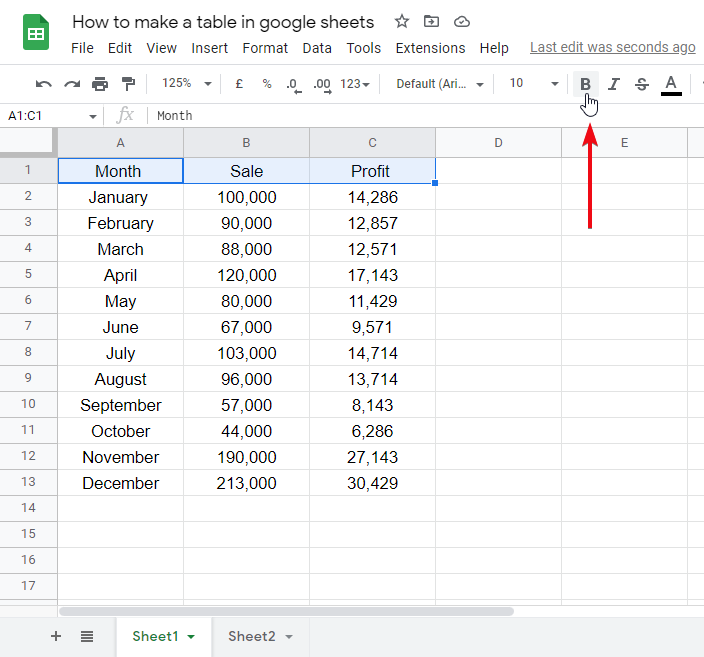
Select headings and do the following edits
font-weight: bold
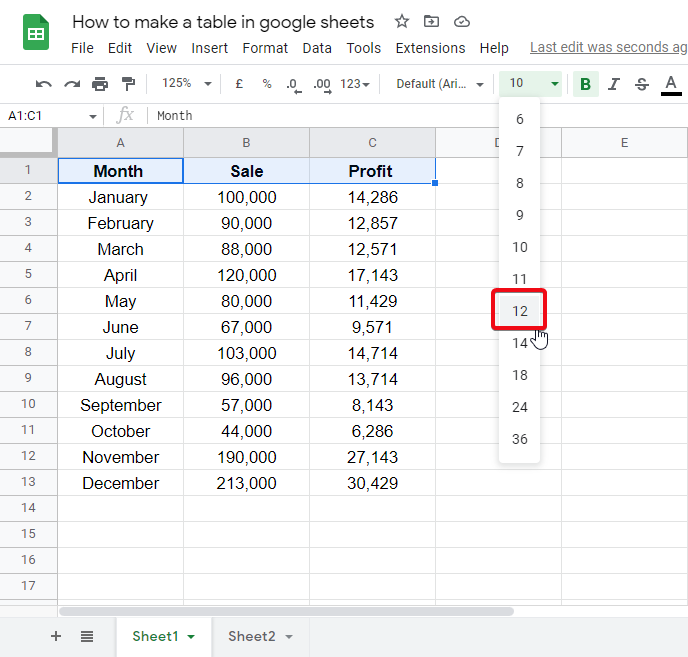
font-size: 12px
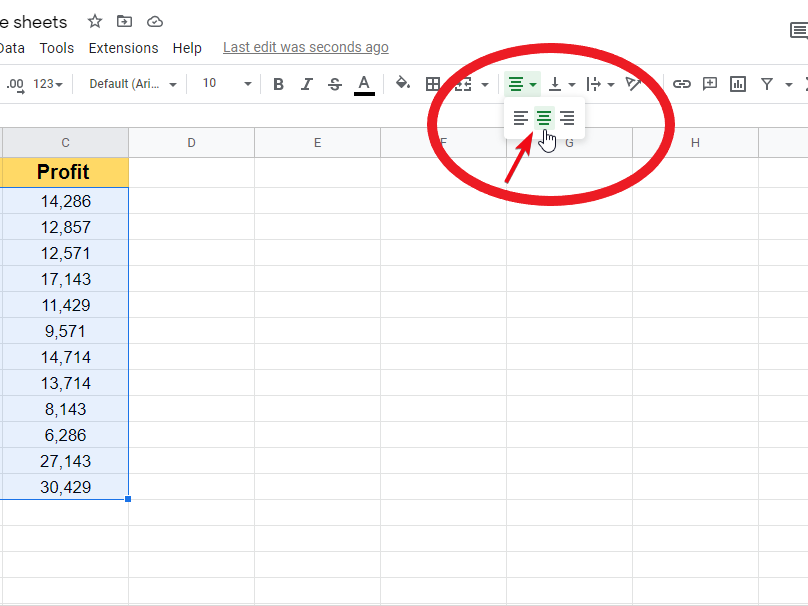
text-align: center
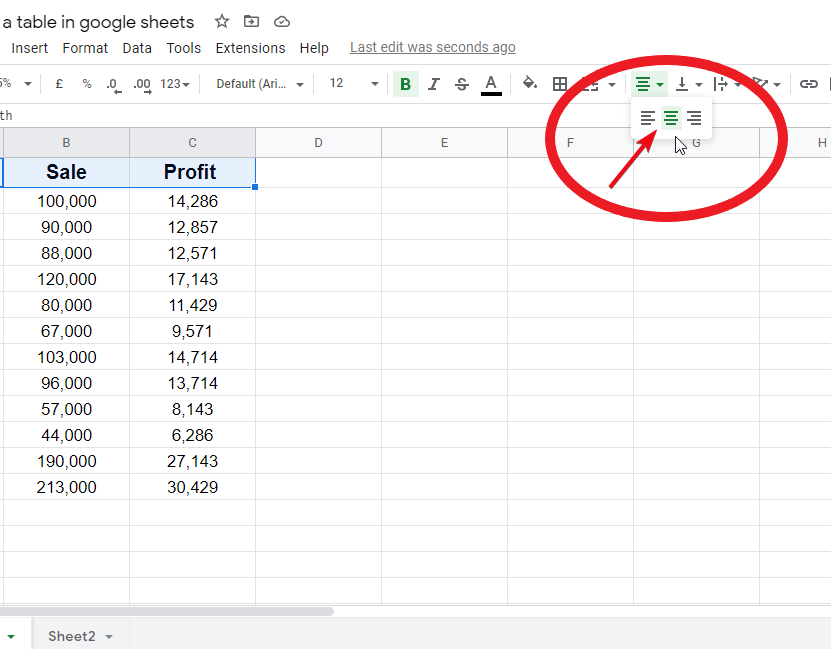
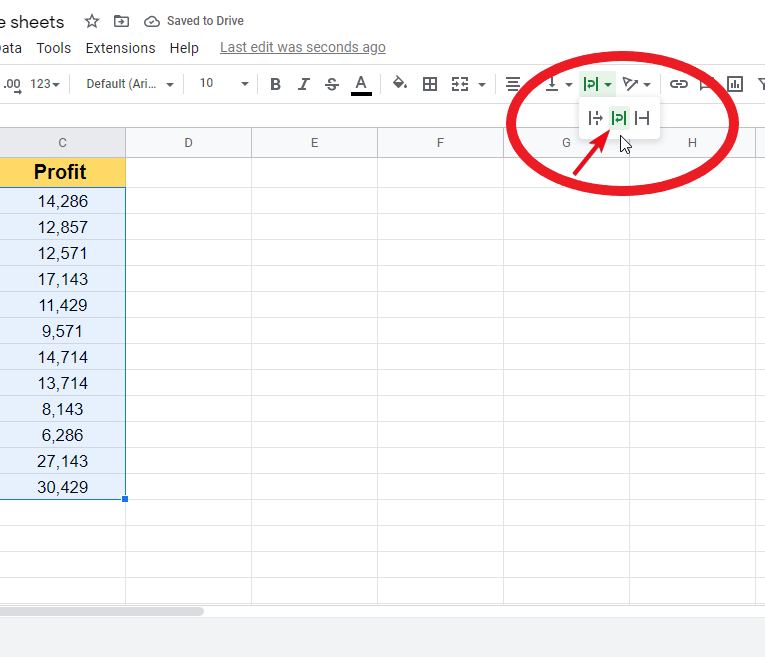
vertical-align: middle
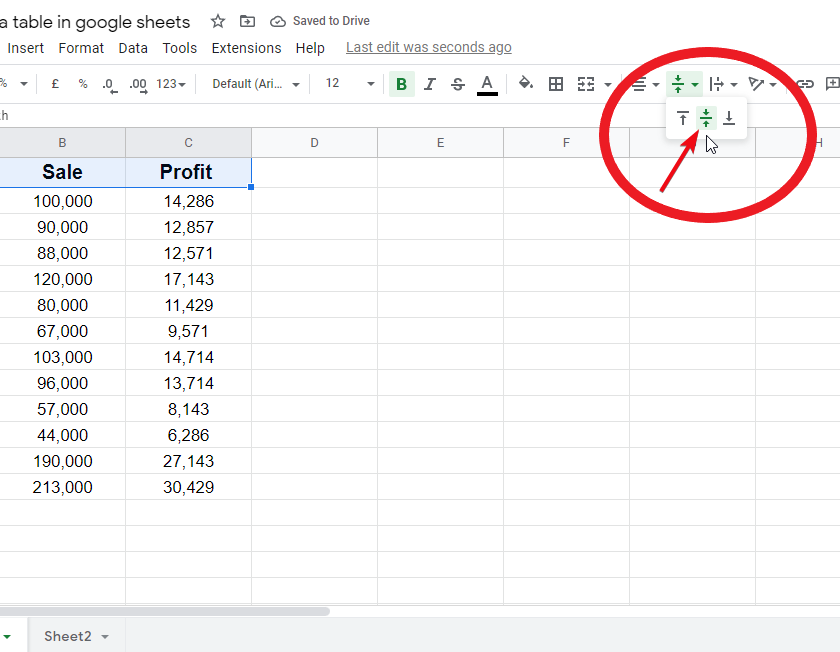
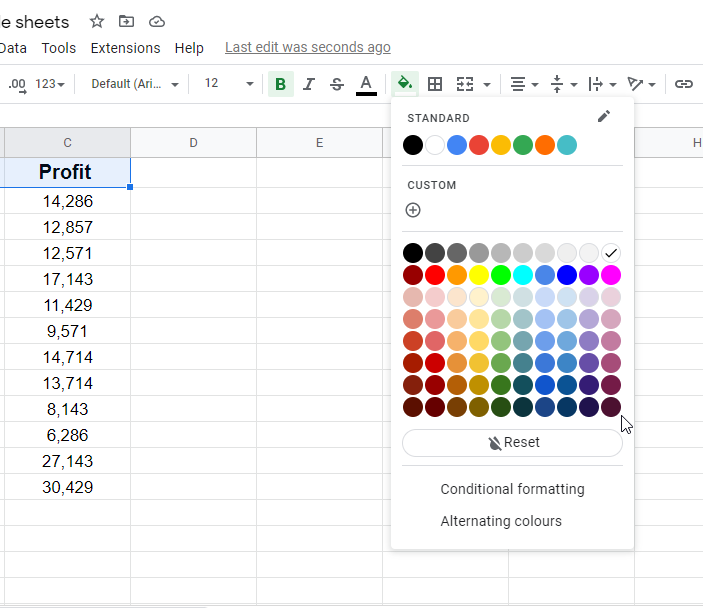
background-color: any color
Step 3:
Select all the tables excluding headers, and do the following edits
text-align: center
vertical-align: middle
border: all borders
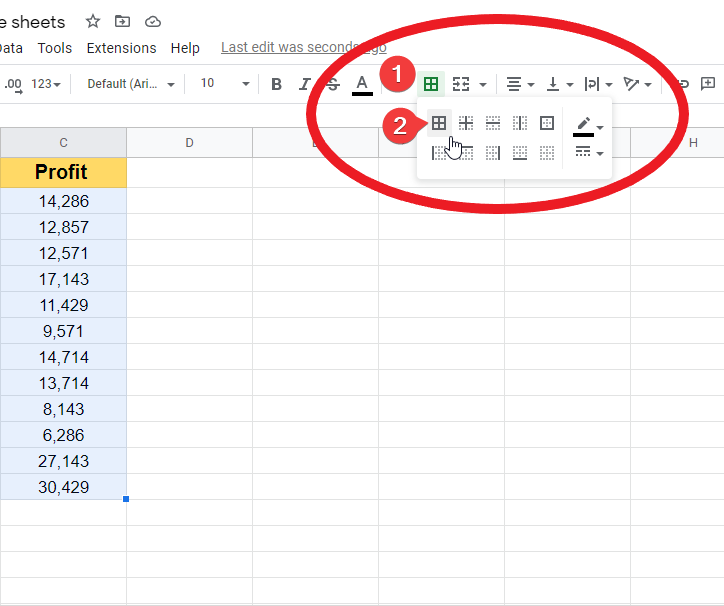
Finally, the data table will look like the below picture.
How to Make a Frequency Table in Google Sheets
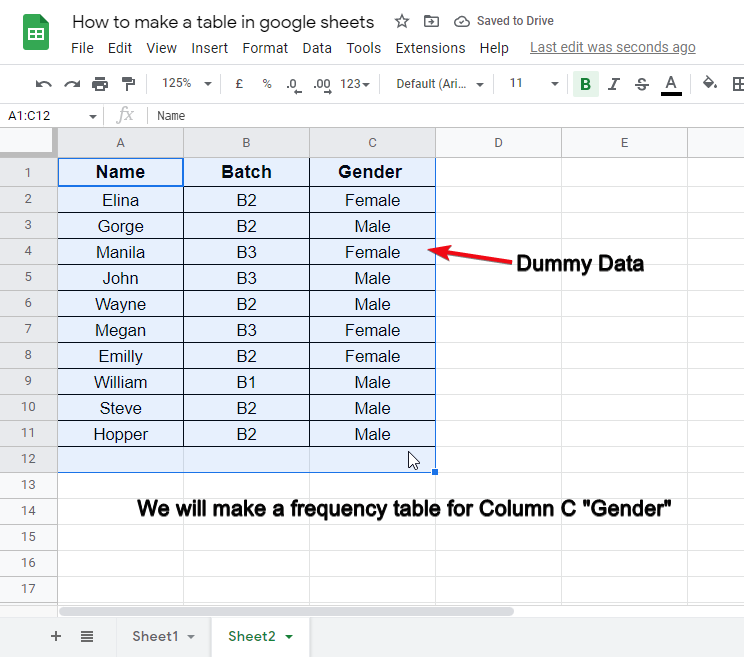
In this section we will see how to make a frequency table in google sheets, let’s understand what foes frequency table means, frequency table means a table that can calculate the frequency of variables inside the table. We will use a pivot table for this, so let’s move on to the step-by-step procedure.
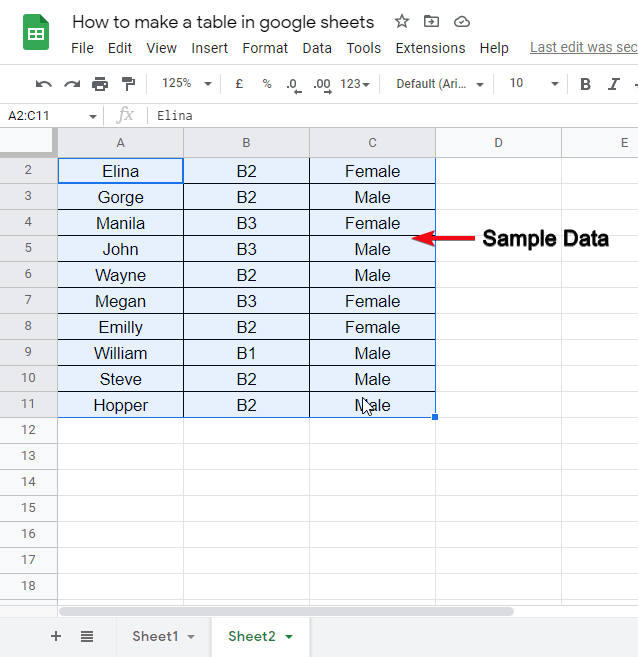
Step 1:
Bring some data or make some sample data.
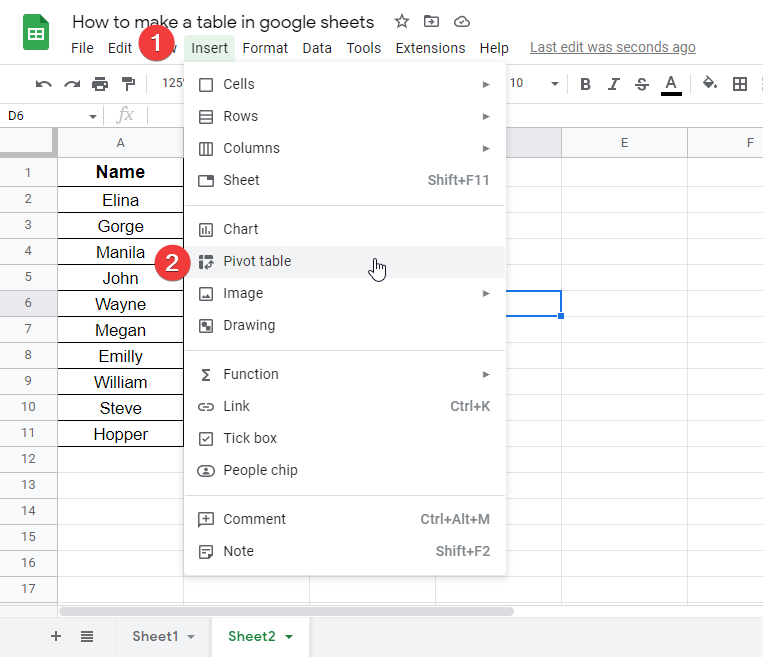
Step 2:
Go to Insert > Pivot Table
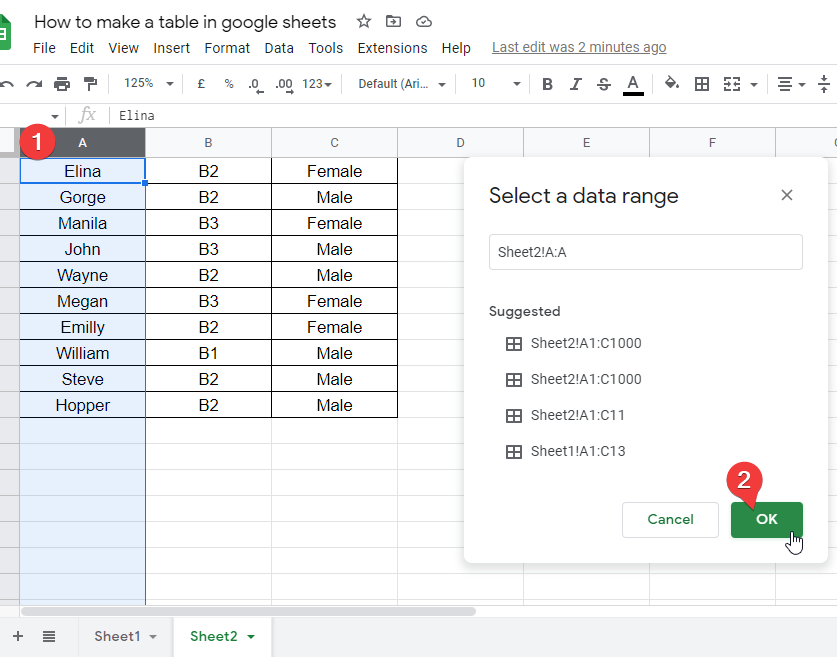
Step 3:
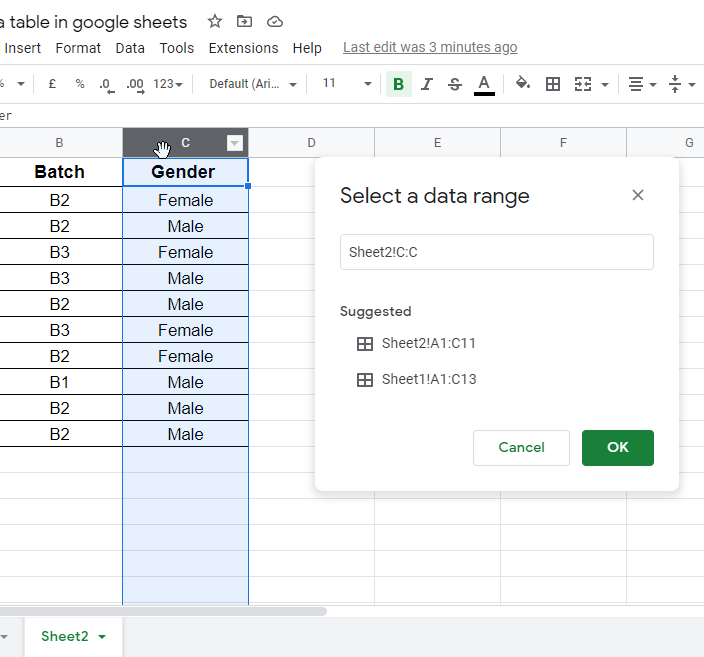
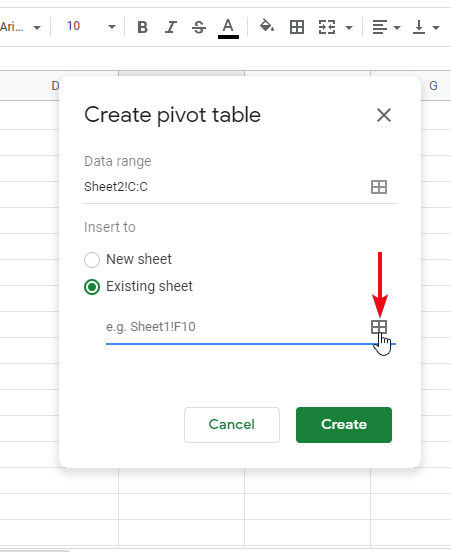
Select the data range (select the entire column from which you want to calculate frequency).
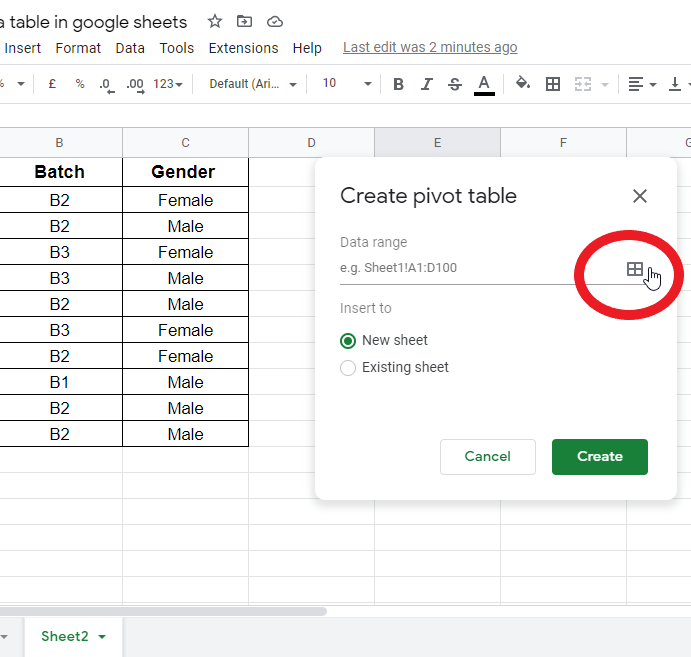
Select a data range using your mouse.
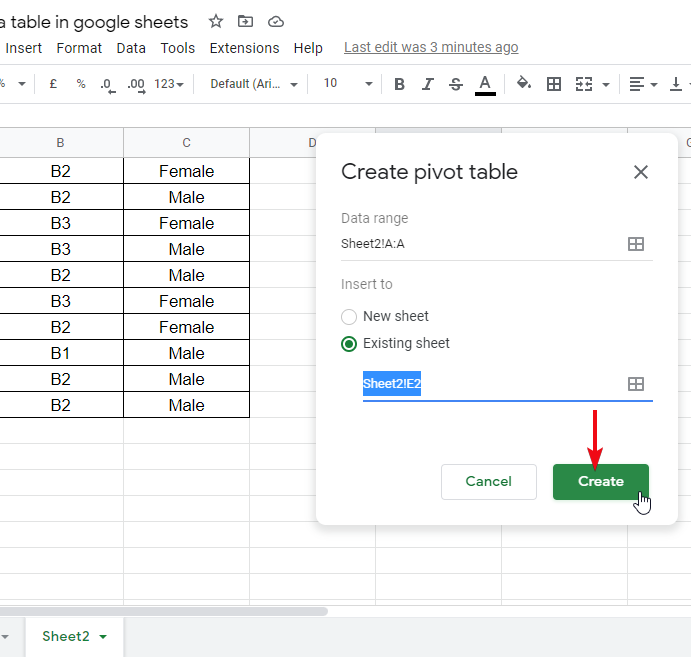
Check on Existing sheet from Create pivot table option.
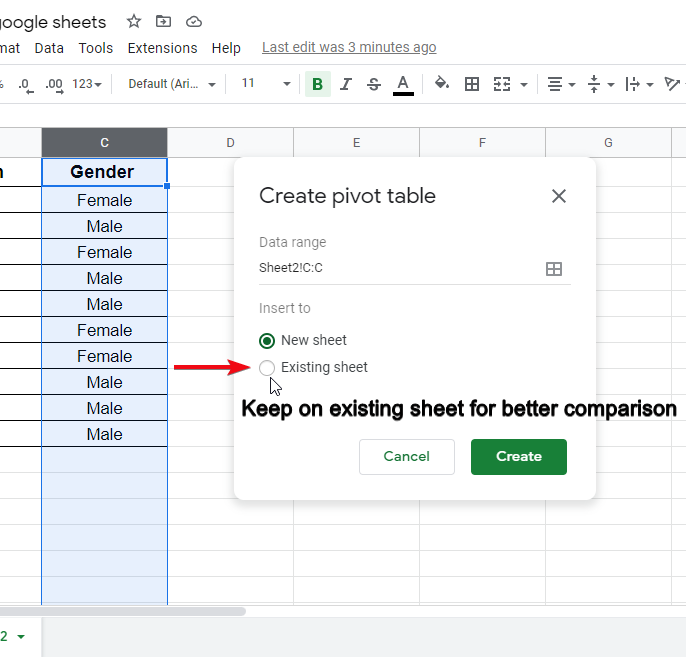
Click on Create button.
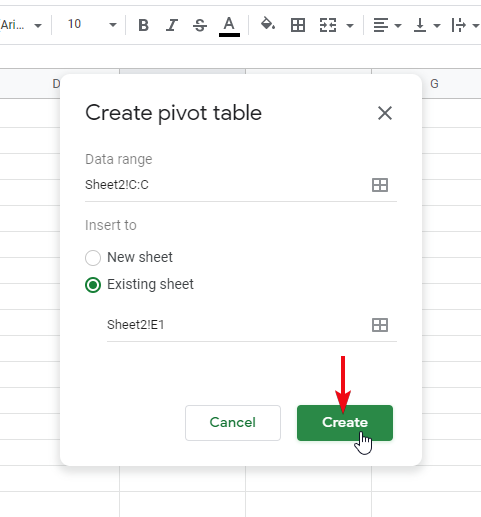
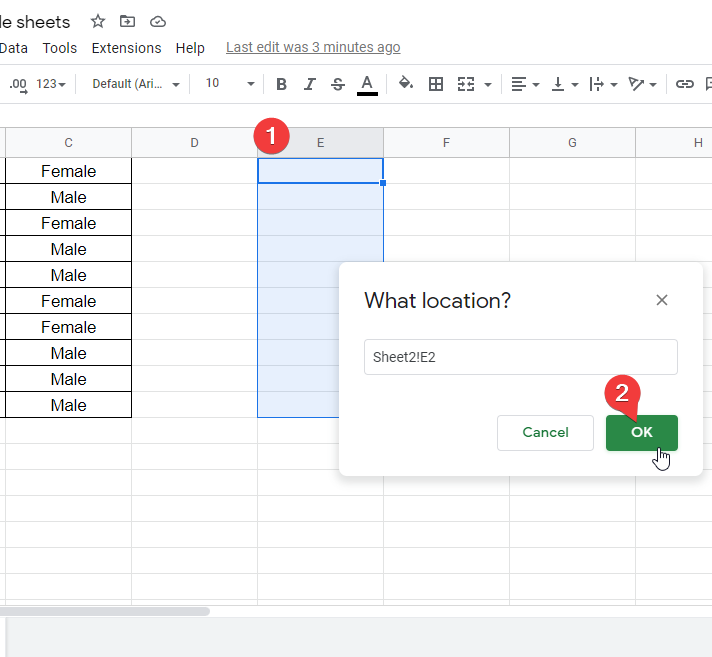
Step 4:
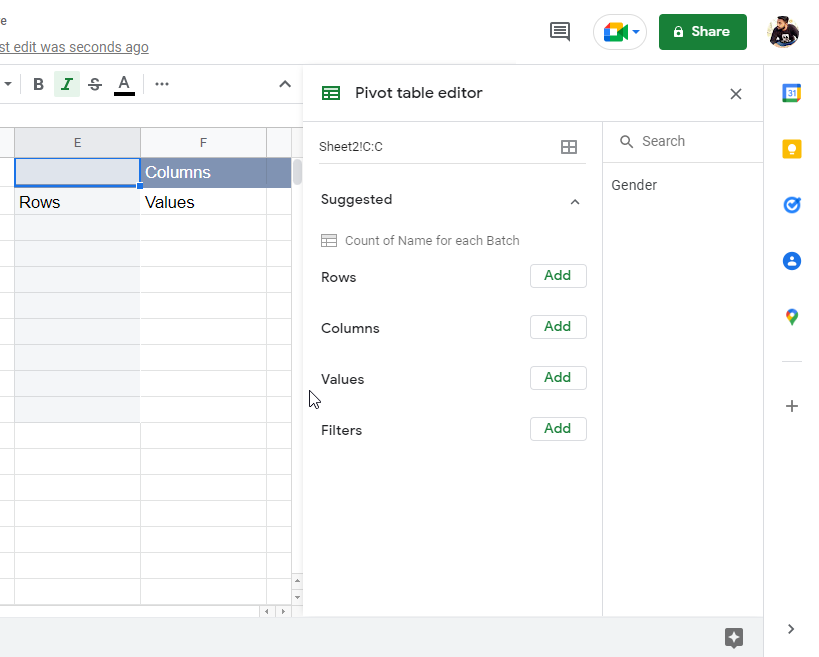
Select the location where the new pivot table should locate
Step 5:
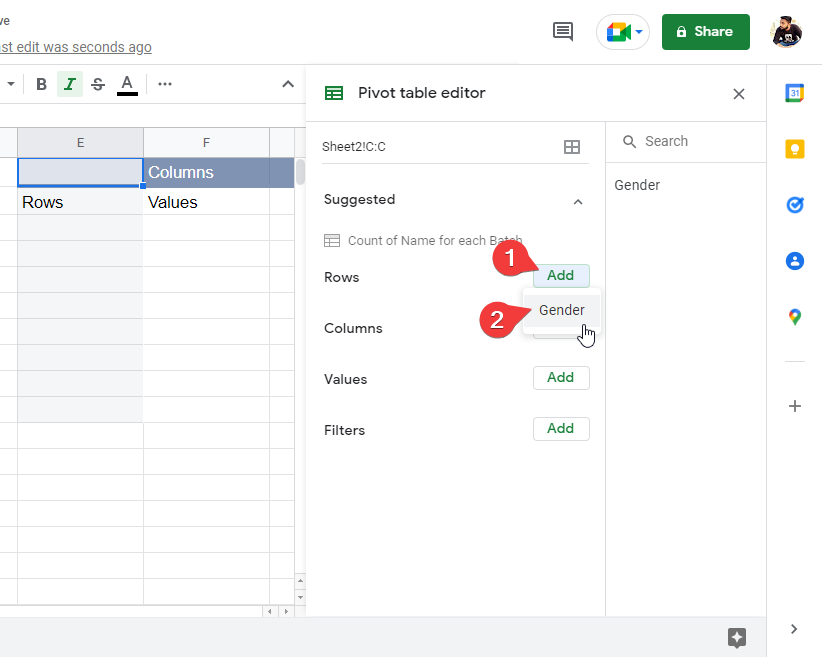
In the Rows section, click add > click the column name (Gender)
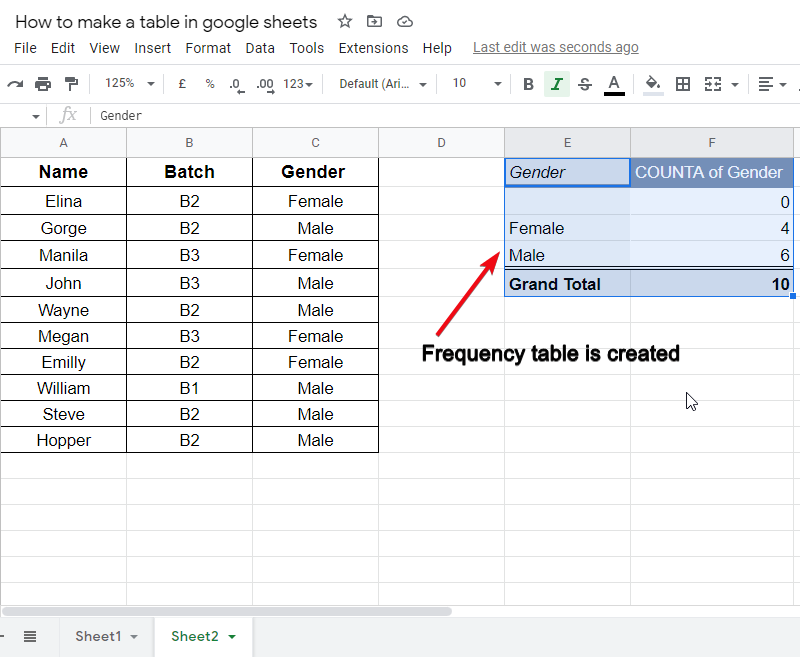
Step 6:
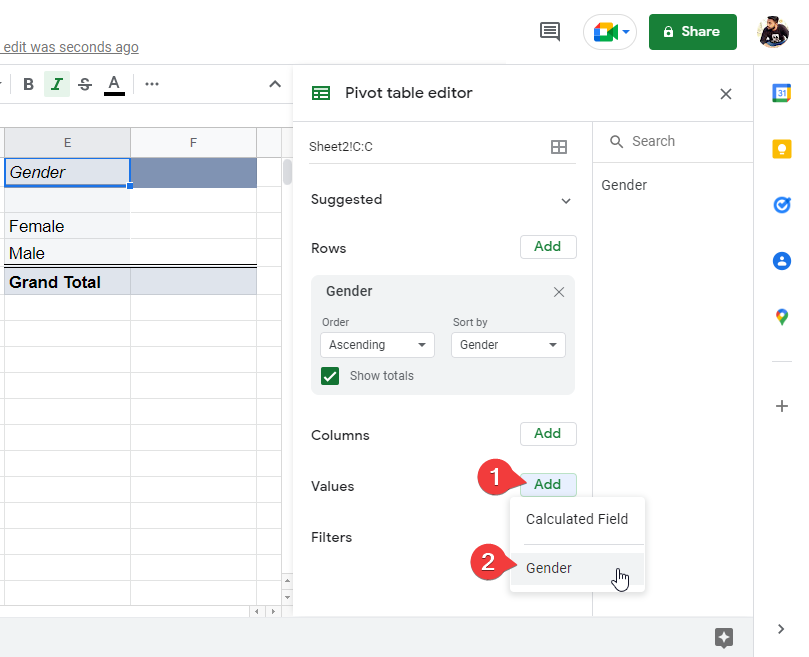
In the Values section, click add > click the column name (Gender)
Step 7:
Your frequency table is ready you can see the frequency of the items inside that column
How to Make a Sortable Table in Google Sheets
A sortable table can also be made using pivot table features, in this section, we will see how to make a sortable table using a pivot table, we will use the same table and will make a pivot table for the name column and it will be sortable in ascending and descending order. Let’s see how can we do it. Let’s move to the step-by-step procedure.
Step 1:
Use the same table as we used in the previous section
Step 2:
Follow the same steps to make a pivot table, this time pick column A (Name).
Step 3:
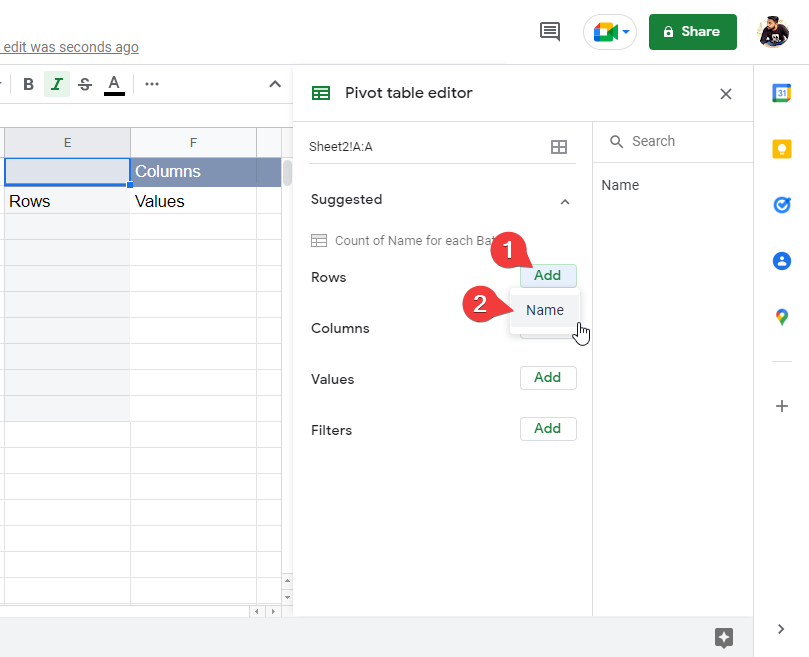
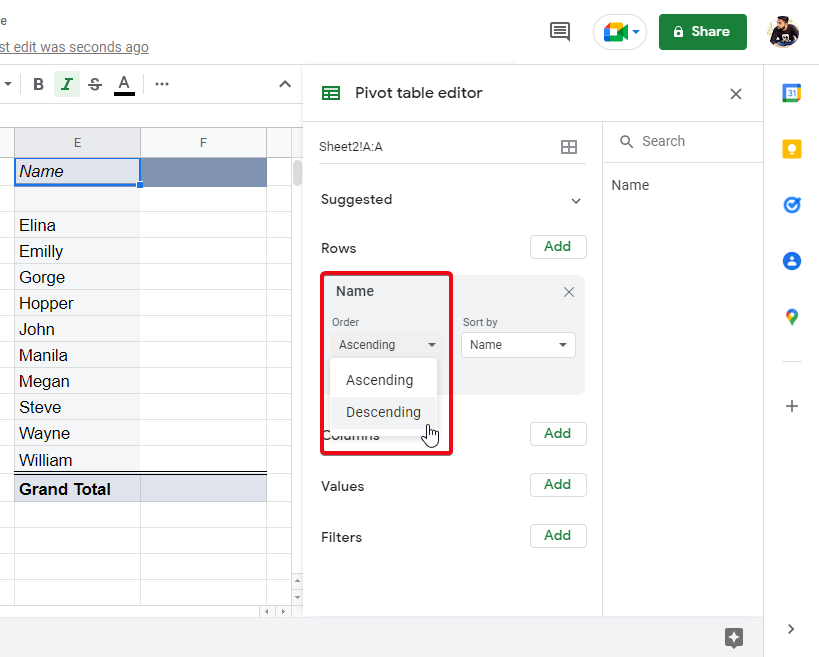
In the Rows section, add Name and select an order ascending or descending to sort the column automatically. Wow! isn’t it amazing? That’s how you can easily make a sortable table using a pivot table in google sheets.
For example, select order as Descending to sort the data in descending order.
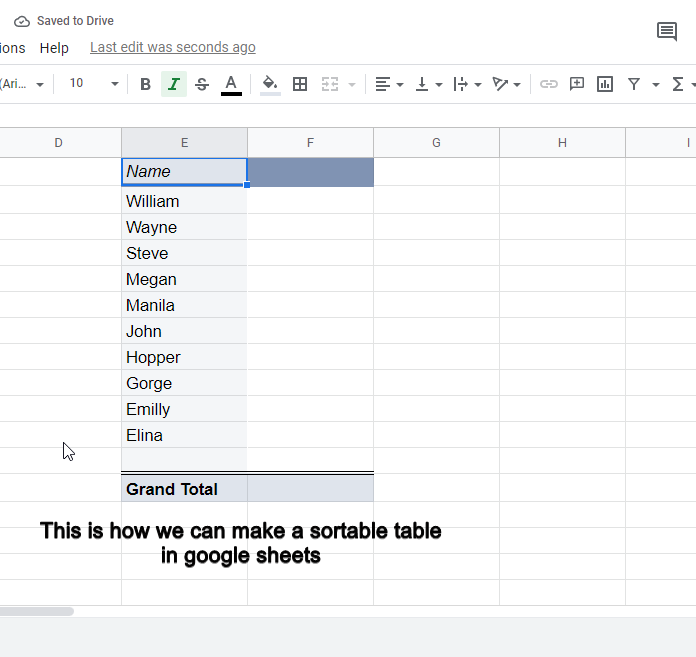
This is how we can make a sortable table in google sheets as illustrated below.
How to Make a Multiplication Table in Google Sheets
In this section, we will learn how to make a multiplication table in google sheets in less than 1 minute (after practice), this is the most awaited section for school goings, let’s get into it and learn how to make a multiplication table with a quick trick.
Step 1:
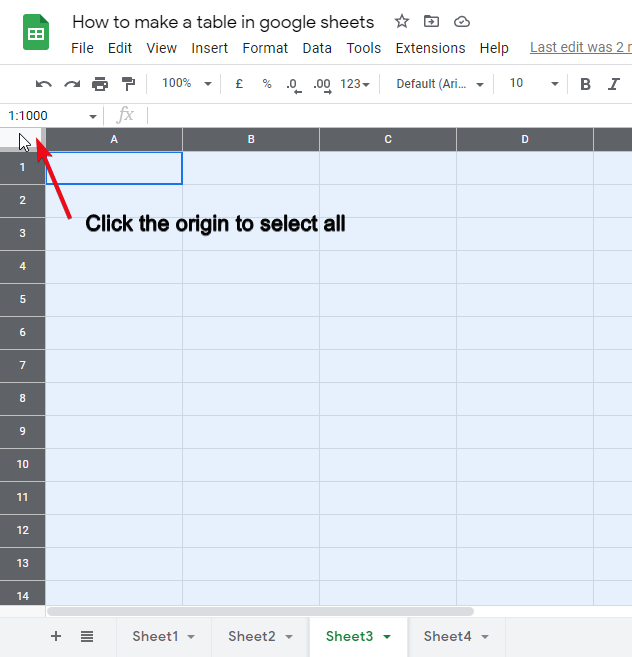
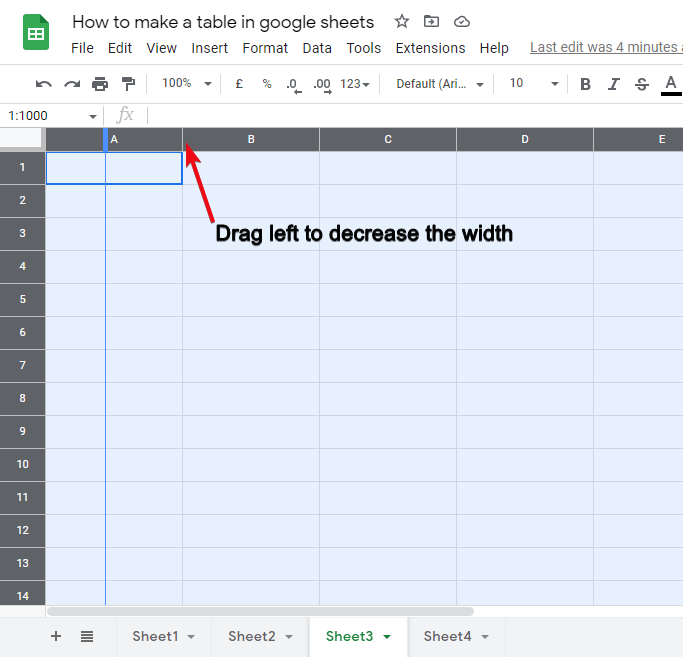
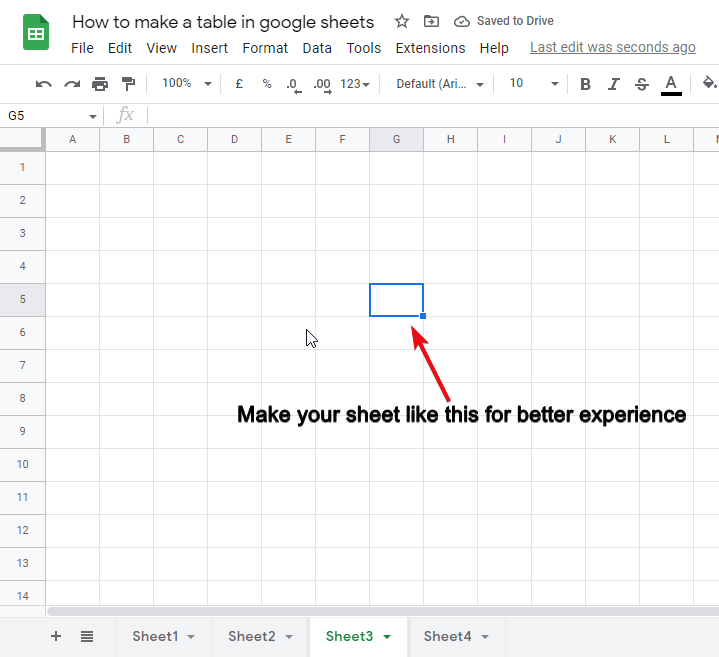
Firstly, increase the height of all cells and decrease the width. Make them like math notebook boxes.
Step 2:
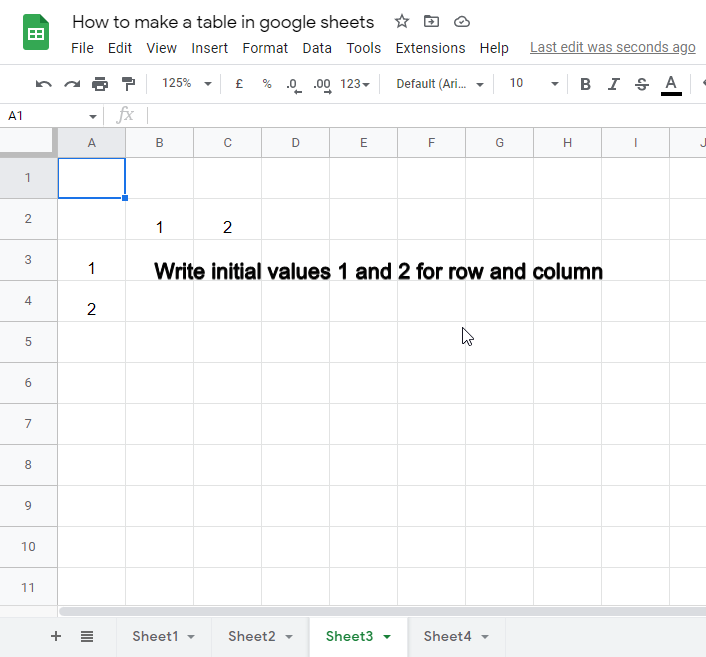
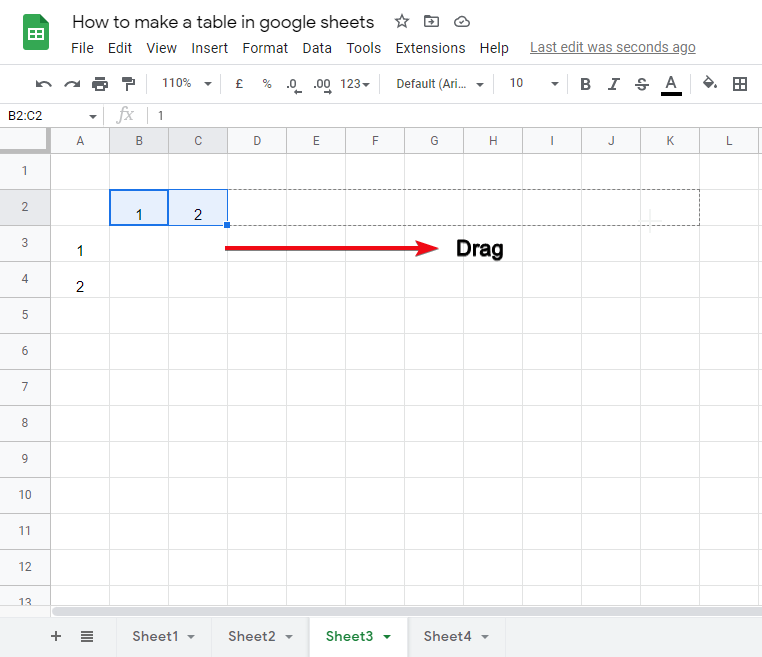
Write 1 and 2 in the B2 and C2 cells respectively, and 1 and 2 again in A3 and A4 cells respectively
Step 3:
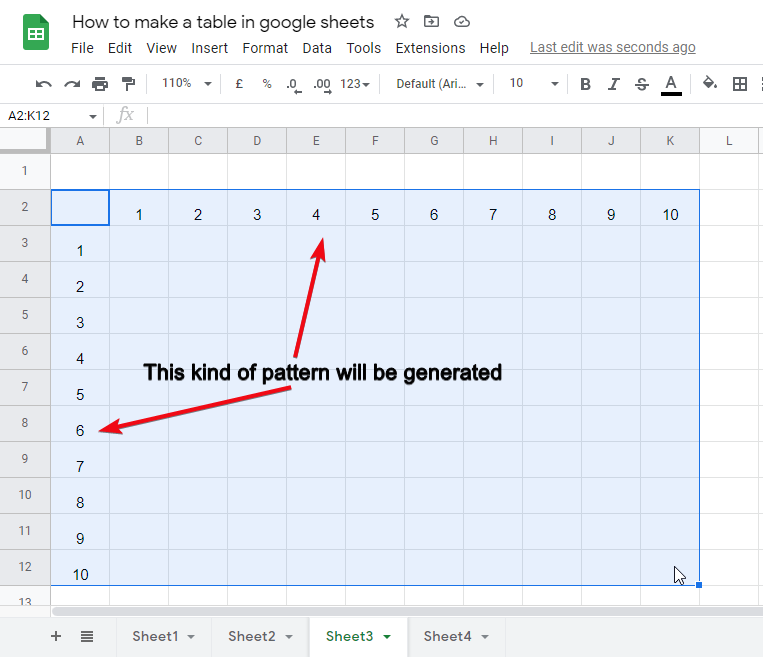
Select B2 and C2 and then drag rightwards (by holding the blue dot point at right bottom corner) from cell C2 up to cell K2. It will auto-fill 1-10 series in row 2
Step 4:
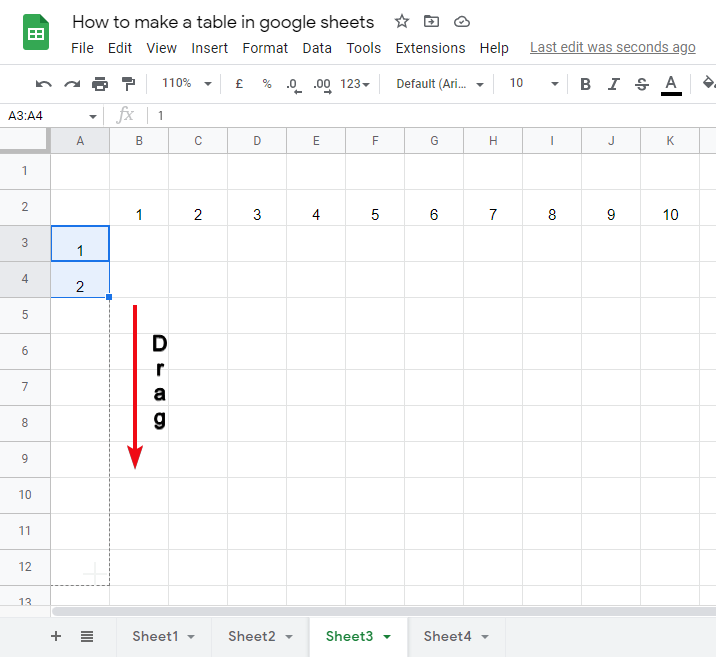
Similarly, select A3 and A4 and then drag below from cell A4 up to cell A12. It will auto-fill 1-10 series in column A
Step 5:
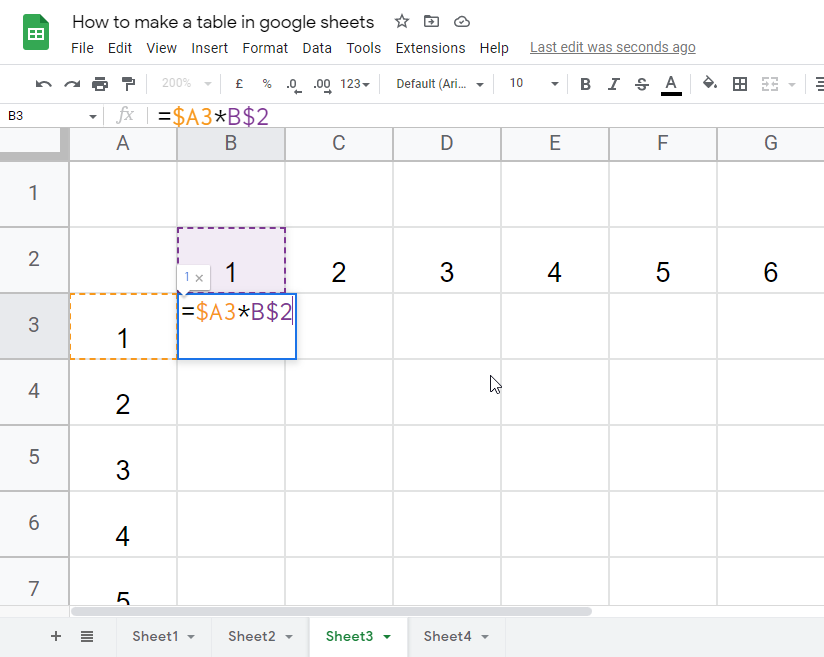
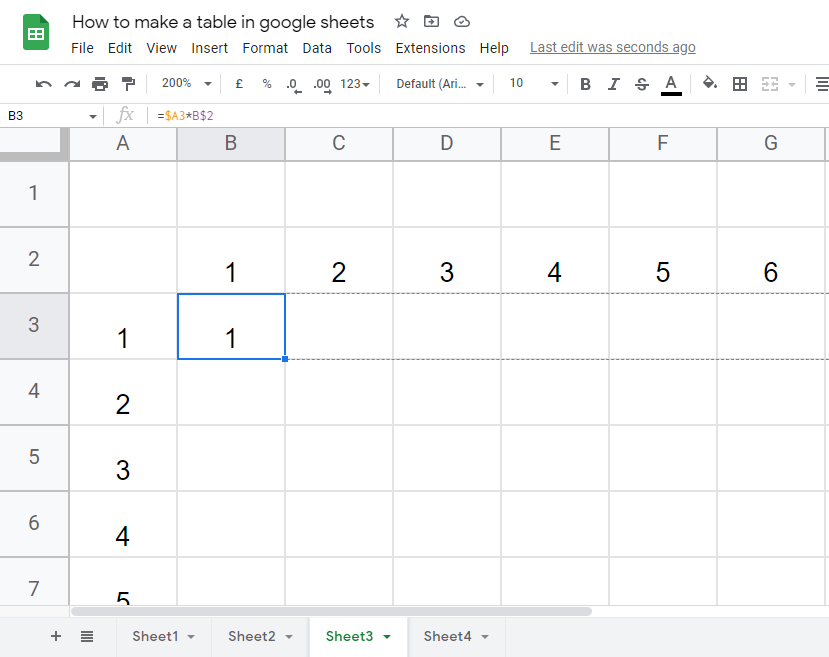
Now in cell B3, carefully write the formula to generate a table
Formula: =A3*B2
But it may generate some errors, so instead, we will use it with $
Formula: =$A3*B$2
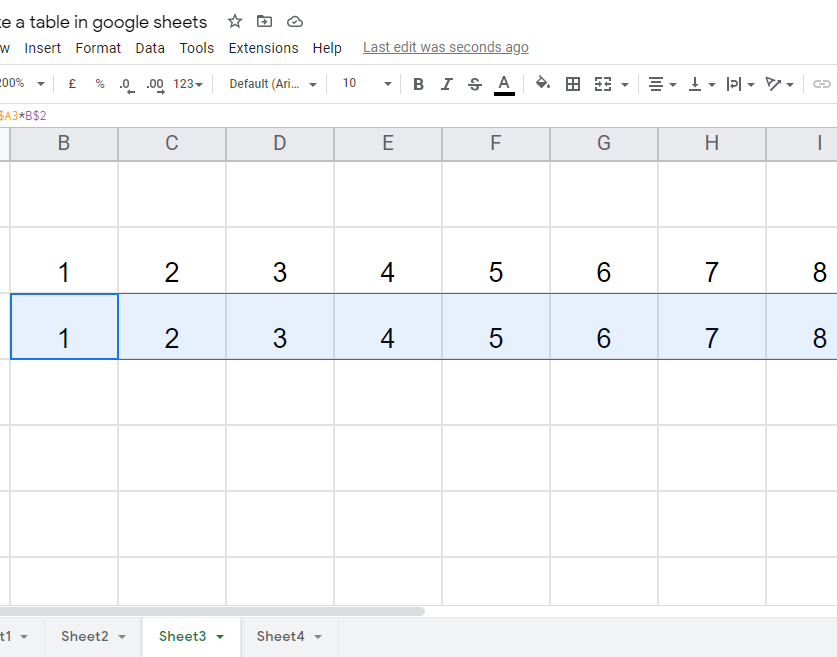
Step 7:
Drag it to automatically fill the row.
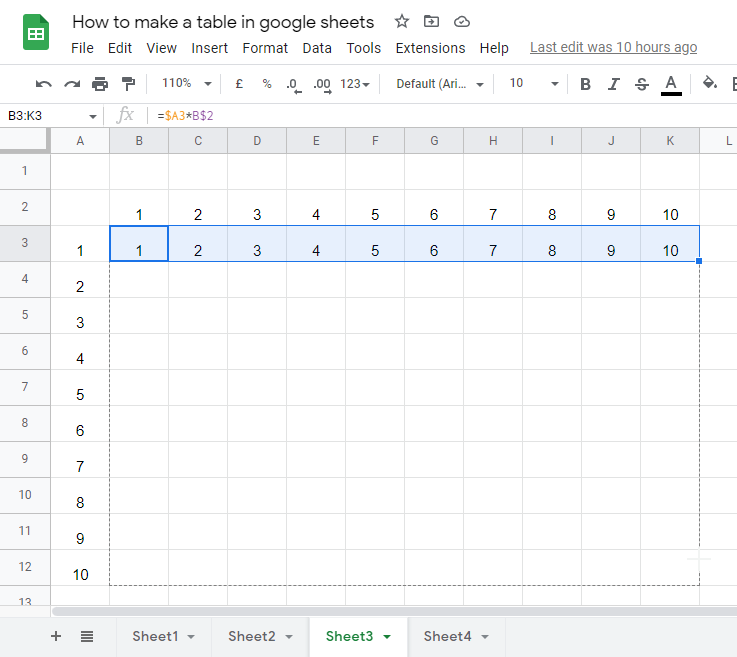
Step 8:
Select the entire row and drag down/below up to row 12.
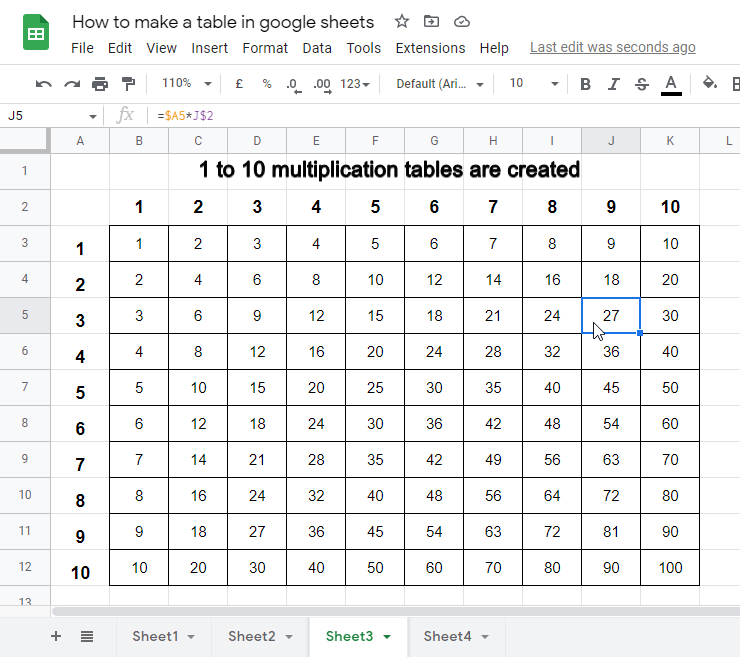
Step 9:
Multiplication tables are ready, you can make them up to 20 or 100 as you want.
How to Make a Table Chart in Google Sheets
Now, in this section, we will see how to make a table chart in google sheets, charts represent the data vary greatly and the tables are already said to be the best form of data presentation, we will how can we convert a simple table data into a table chart very easily. Follow the steps below to learn how it is done.
Step 1
Open a sample table of data.
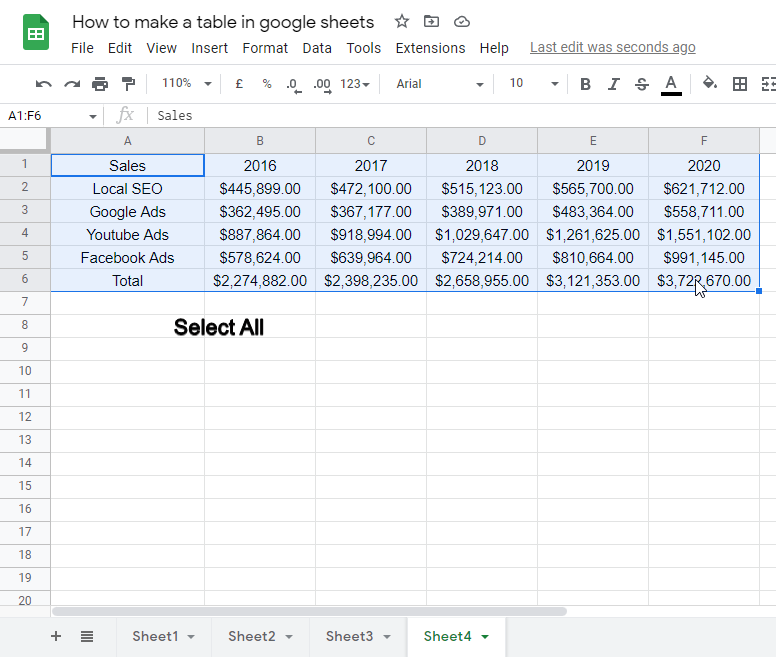
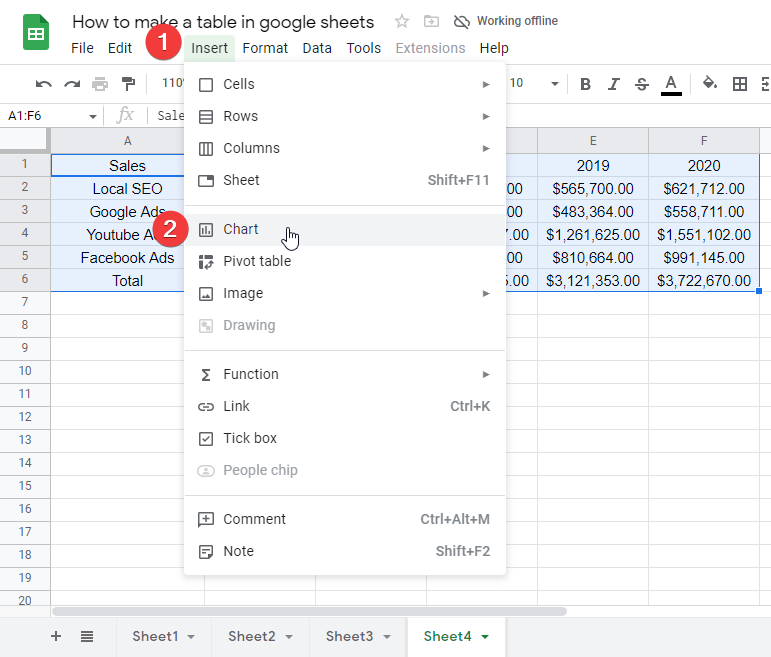
Step 2
Select the entire table data, and click on insert > chart.
Step 3
From the many available charts, scroll down and find the table chart.
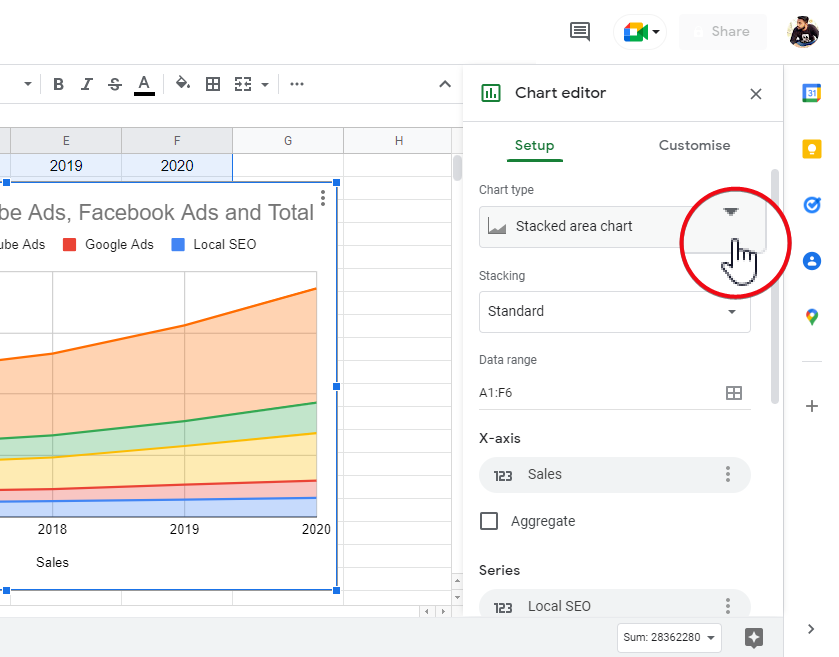
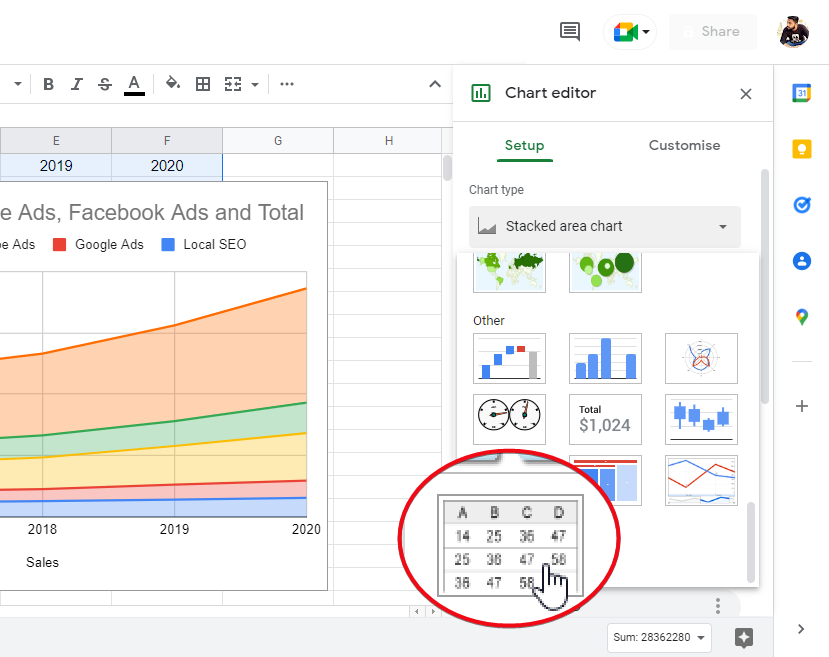
Step 4
Click on the table chart, and see your data is automatically reflected in a table chart.
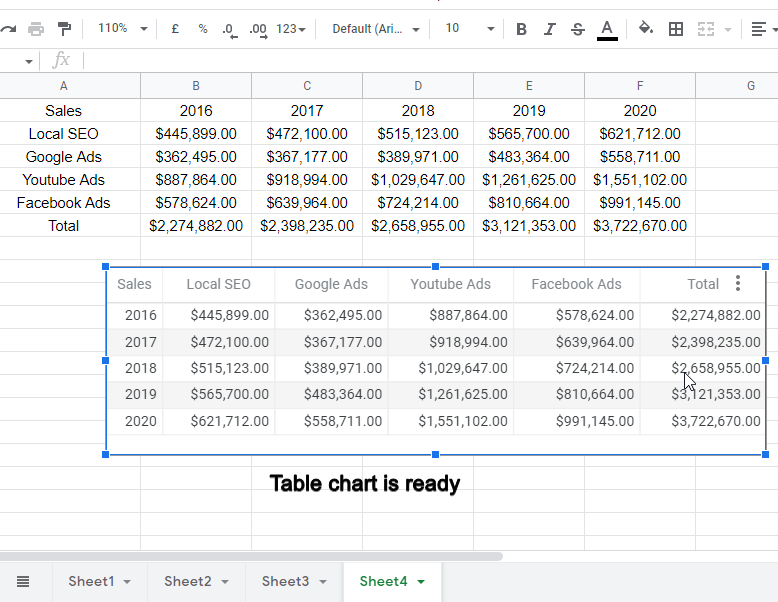
This is how we can make a table chart in google sheets in 1 minute.
Important Notes
- Always remember that any table can be transformed to pivot tables, if you want quick calculations, averaging, frequency, sorting, hide expand feature, and much more then you should go for pivot tables. They are amazing!
- A table is nothing but a tabular representation of the data, in google sheets what we write is already written in tables as the google sheets provide a table-like interface by default,
- We have covered how can you a simple minimal table in a few minutes and make your table look more powerful and communicative.
- In a section above, you learned how to make multiplication tables in google sheets in 1 minute, and it was really quick, we made tables from 1 to 10 and those were going till 10 x 10. But, keep in mind that you can make as many tables as you want also you can make tables till 20 30 50 anything you want. But also remember that you have to be in a sequence otherwise this formula will not work.
Frequently Asked Questions
Is the Process of Making a Table in Google Slides Similar to Making a Table in Google Sheets?
Creating tables in google slides is not the same as making a table in Google Sheets. While Google Sheets allows for data manipulation and calculations, Google Slides primarily focuses on visual presentations. The process of making a table in Google Slides involves using the Table option in the toolbar and manually adjusting the size and design to fit your presentation needs.
Conclusion
Wrapping up the entire learning we gained today, the learning outcomes from this article here, we learned several kinds of tables in google sheets, most importantly we had a look at pivot tables, we saw how to create a pivot table, and also shown you the quick examples of pivot table features sorting in a table, and frequency tables, afterward, we learned more things about tables, and table charts. This was a comprehensive article for teaching about google sheets tables, we have a lot more topics to come. So, stay connected to maximize your learning. Follow OfficeDemy‘s blog for exciting updates and share this article with your friends and let them also learn some cool google sheets tips and tricks. Thank you!


