
To Switch Axis in Google Sheets
- Select the data.
- Go to “Insert” and choose “Chart“.
- Click on the chart and select “Edit chart“.
- In the Chart customization pane, switch the axis data.
- Your chart’s axis data is switched.
Google Sheets is becoming the most useful tool for spreadsheets because of its tremendous features which top of the feature is a collaboration of the users in real-time. But if we talk about the data visualization feature of google sheets, we cannot deny it, because Google sheets are working excellently while data visualization produces spreadsheet data for graphs, charts, and other types of diagrams and embed them in websites.
Google Sheets automatically visualize the data and picks a column each for your x and y-axes and create a chart for your data. Although google sheets choose the data perfectly for both the x-axis and y-axis sometimes there may be a need for a switch axis, then there is not to worry google sheets is providing all customization features to their users to format your chart according to their desire.
So, if you dislike google sheet data visualization and want to change the axis in your chart then this article is for you in which we are going to learn how to switch axis in google sheets. If you are not aware of how to switch axis in google sheets then read the following tutorial in which we will convey to you a deep lesson step by step to change the axis data of your chart.
Why do we need to Switch Axis in Google Sheets
As you know Google workspace is upgrading its software day by day to make them more featured and functional. Recently Google’s open-source AI tech team, TensorFlow, developed some AI artificial intelligence models in google sheets that apply some of the power of machine learning to their data in Google Sheets. This helps the google sheet to visualize data and gives the ability to pick the better choice for your data, similar to the data chart. Google sheets try its best to set up data for the x-axis and y-axis but It may be possible that the axes it picks might not always match what you want. Then in that case you may need to switch the axis in google sheets.
On the other end, there are times when you have to arrange the variables in the spreadsheet before making a chart out of them. For example, while making a scatter plot, it’s recommended that the independent variable should be on the left while the dependent variable should be on the right. In such a case you may need to switch axes in google sheets. Similarly, there are so many criteria due to which you may need to change axes data in google sheets. Hope you have understood the importance of the above article on how to switch axis in google sheets so, let’s move on to the next section where we will learn how to switch axis in google sheets step-by-step.
How to Switch Axis in Google Sheets
This is an advantage of google sheets that provides flexibility to their users to perform any task in google sheets. So, switching axes in google sheets is also not a difficult task even you can change your axes data in just a few steps. But for any type of chart customization first, we must have a chart on which we can apply the above changes. First, we will insert a chart in google Sheets then will go through the article on how to switch axis in google sheets, in which we will learn how to shift the x-axis data to the y-axis. So, let’s start without wasting our time.
Step 1
Open Google sheets and take a new blank file.
Step 2
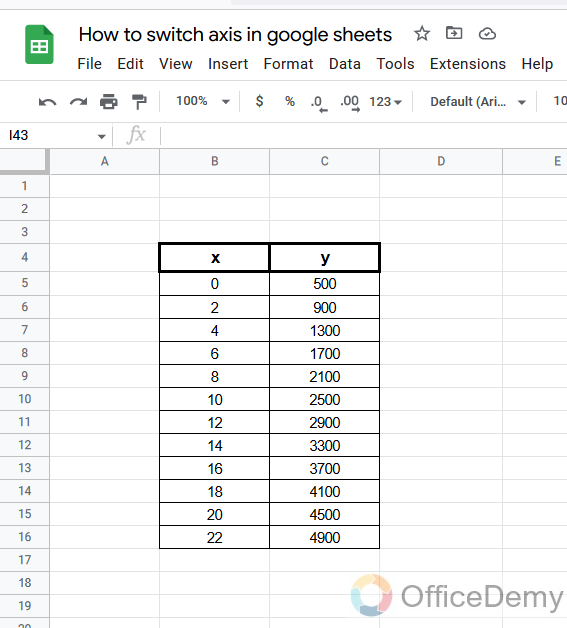
To make a chart you should have such type of data of two variables as shown in the figure.
Step 3
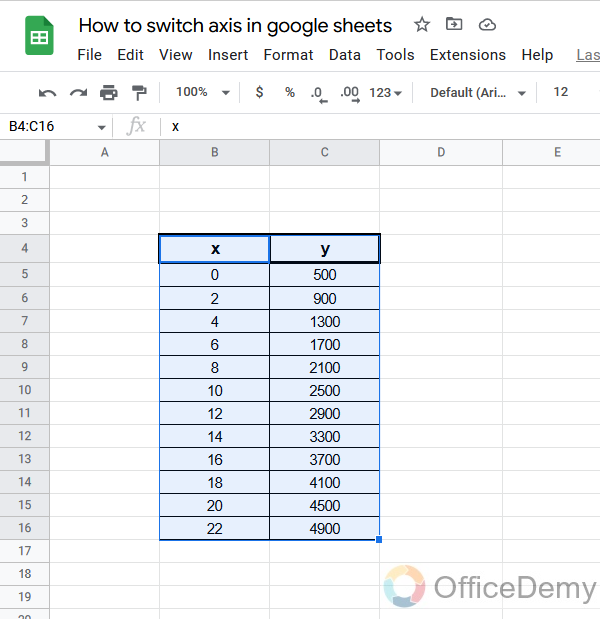
Then just select the data first before inserting the chart in Google sheets.
Step 4
To insert a chart or graph go into the “Insert” tab from the menu bar, a drop-down menu will drag down where you will find the Chart option.
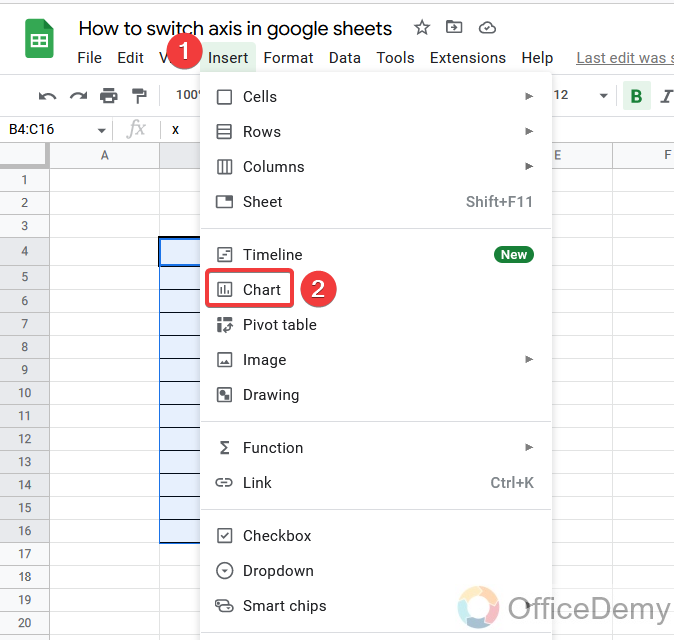
After selecting the data, you can insert the chart with one click on this option.
Step 5
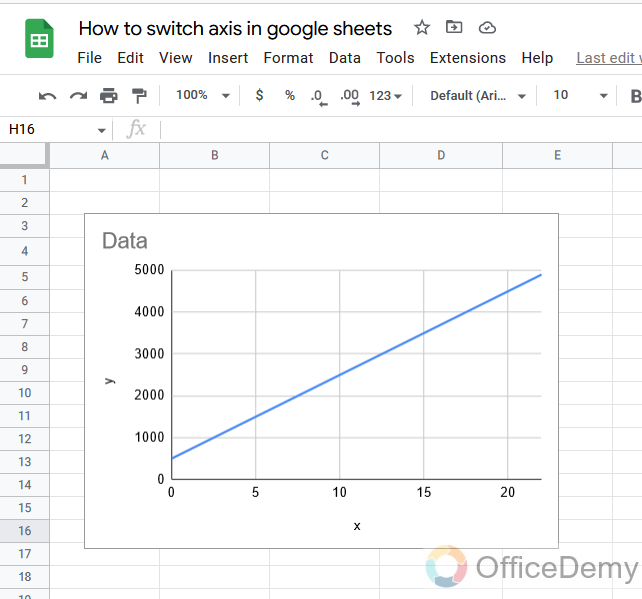
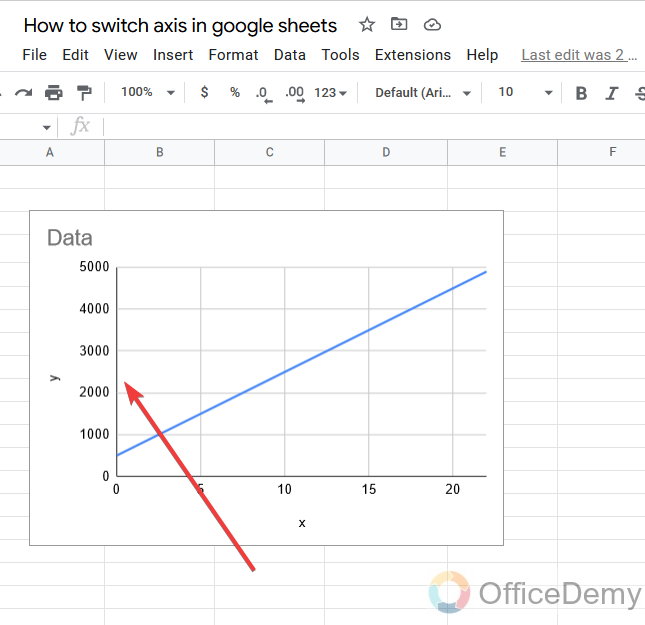
As you can see our chart has been inserted. Where google sheets automatically pick the data for both axes.
If Google sheets don’t pick the data for the axis as you want so you can change it.
Step 6
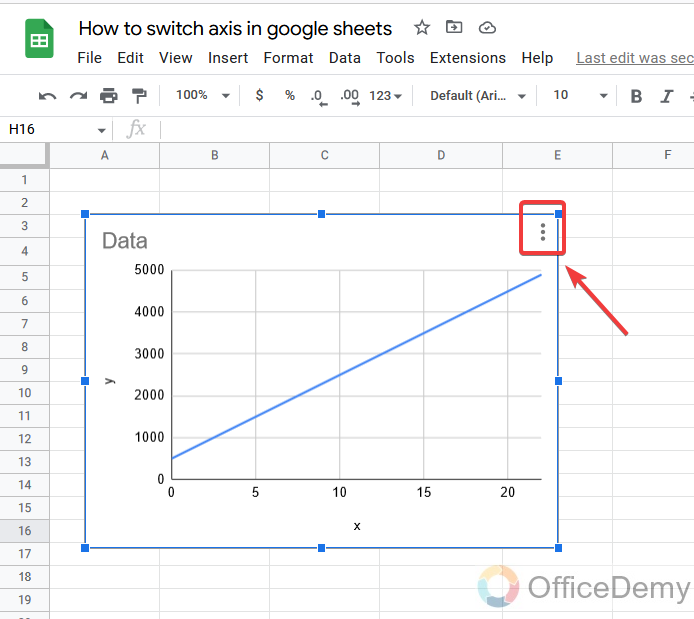
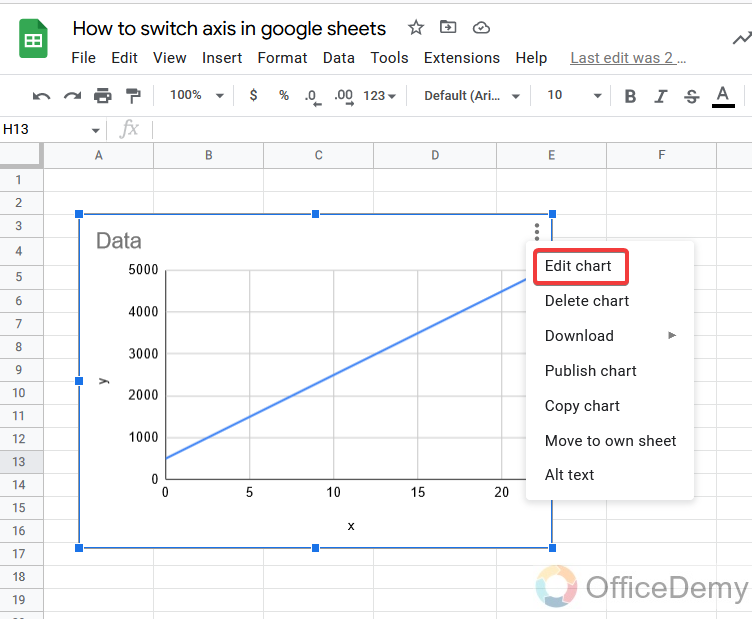
First, click on the chart and a three-dot option will appear at the right top of the chart. Click on it.
Step 7
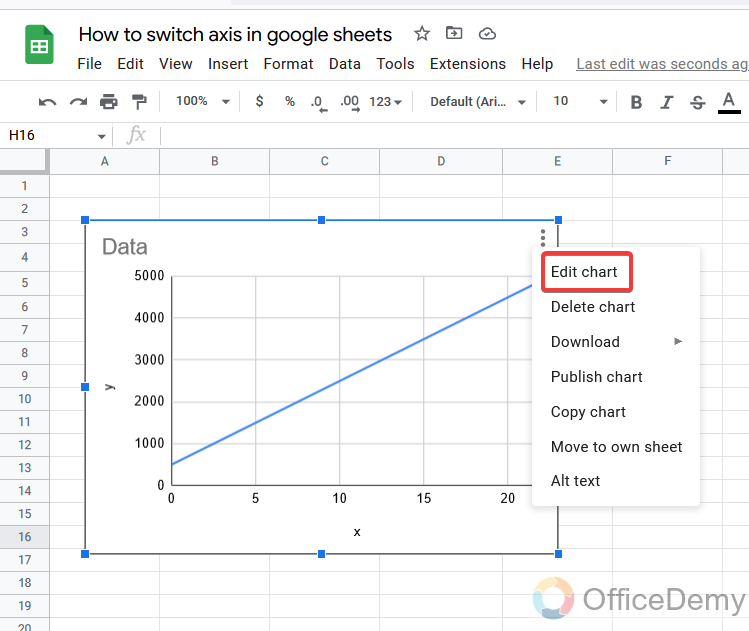
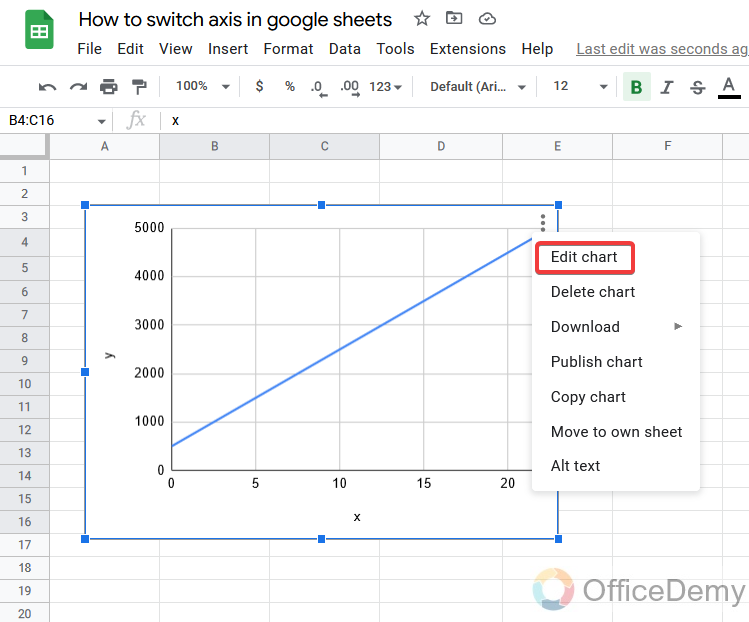
When you click on these three dots options a menu will appear, where you will find the “Edit chart” option. Click on it to open the chart customization pane.
Step 8
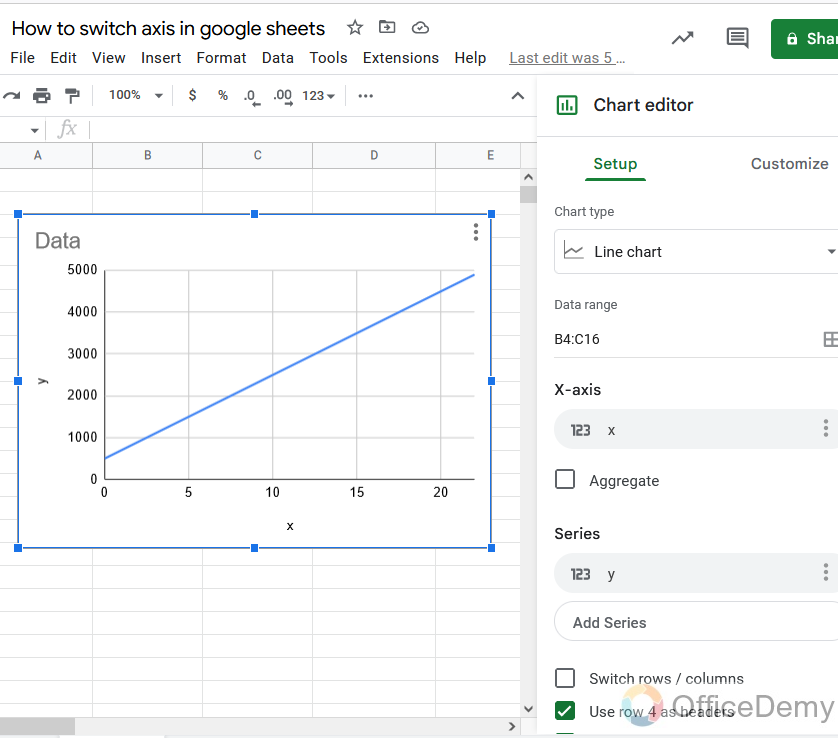
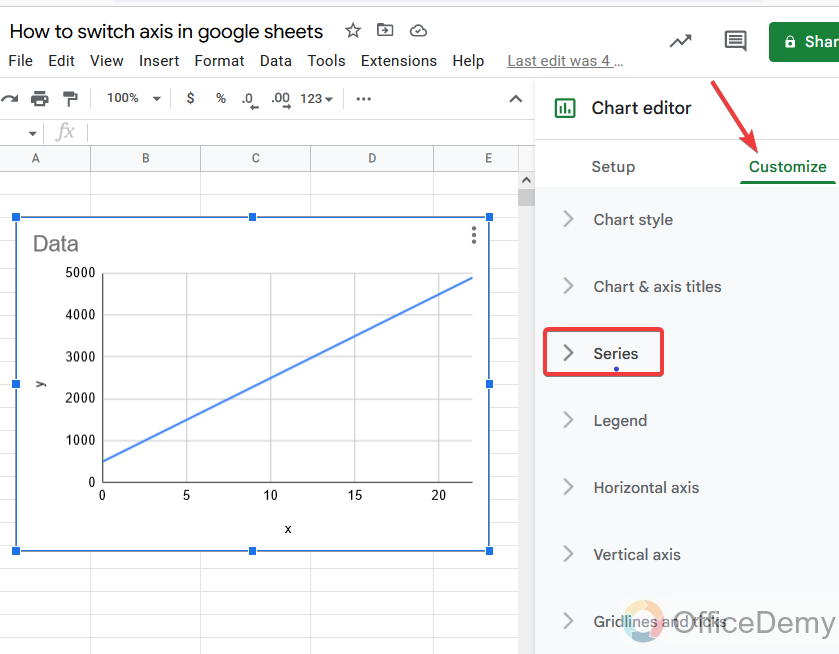
As you can see in the figure, the Chart customization pane menu has been opened on the right side of the window. Where you can do all kinds of formatting for your chart.
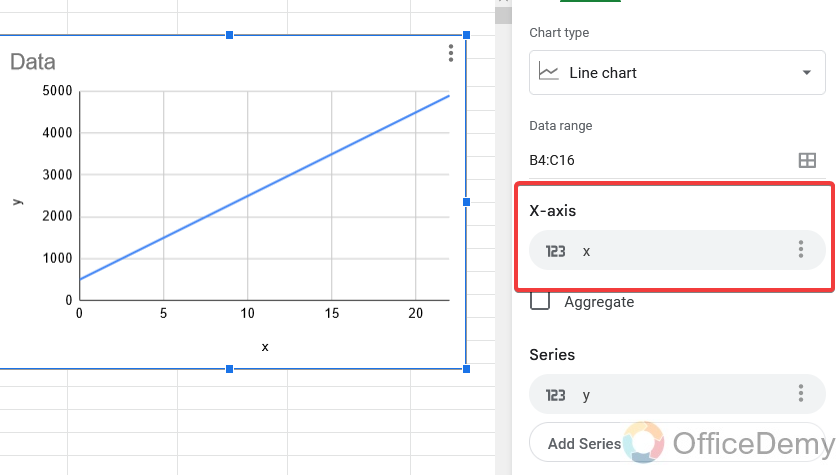
Step 9
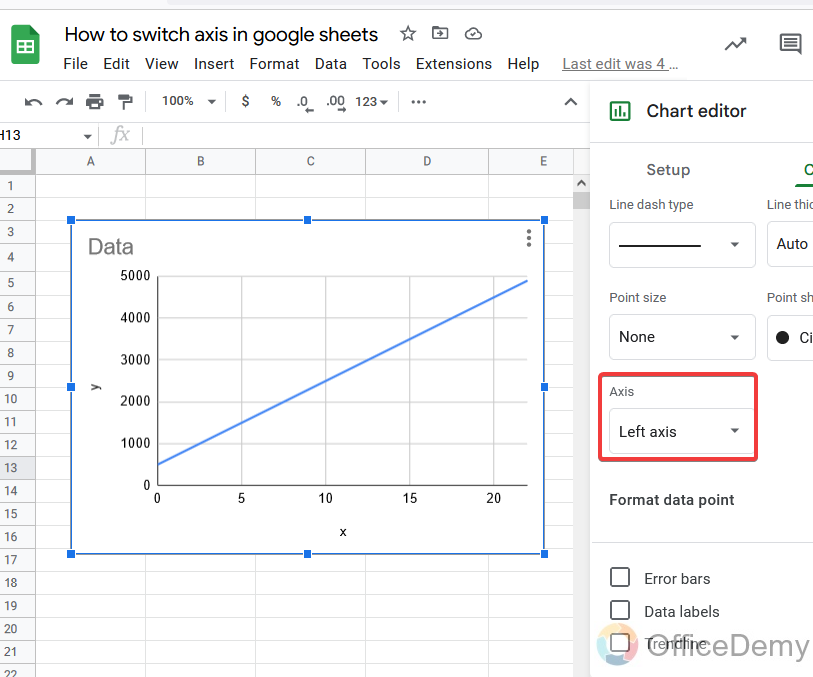
Then to switch axes, look at the front of the pane menu in the chart setup, here you will find the axis data option. As you can see in the figure, I have highlighted the data option for the x-axis. This option shows what data is displayed on which x-axis.
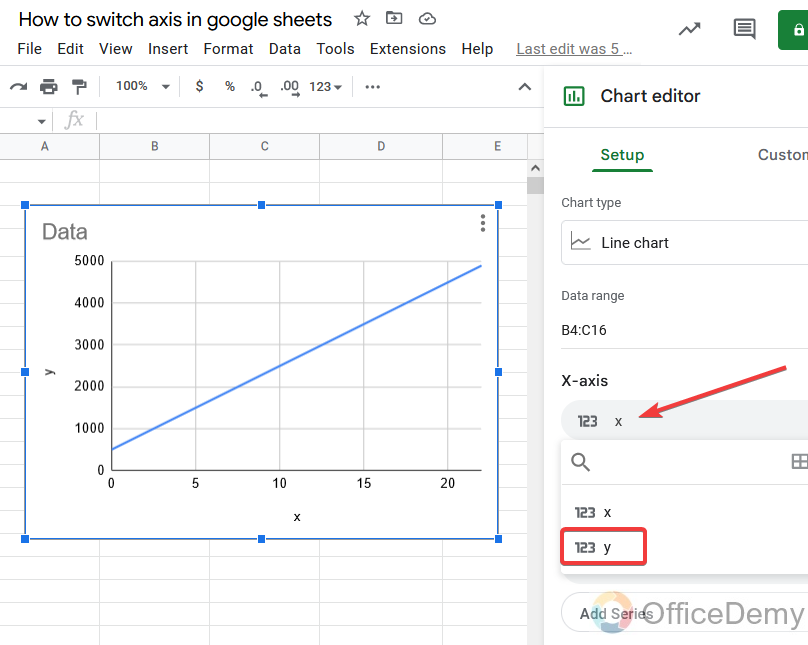
Step 10
When you click on this option, the data option of both axes will be shown, where you can select by your desire what you want to be displayed on the x-axis. As we are switching the axis so here, we will select the “y” so data of the y axis will be displayed on the axis.
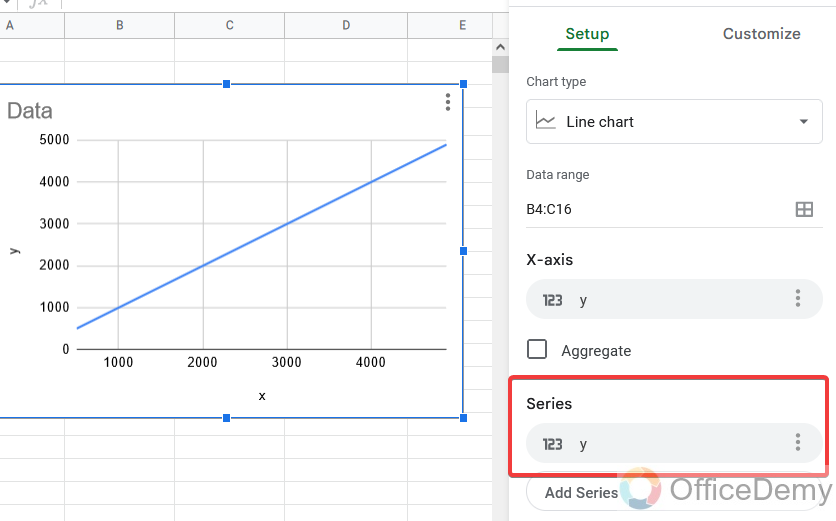
Step 11
Similarly, for the y-axis, there is an option namely “Series” where you can select the date of your choice on the y-axis.
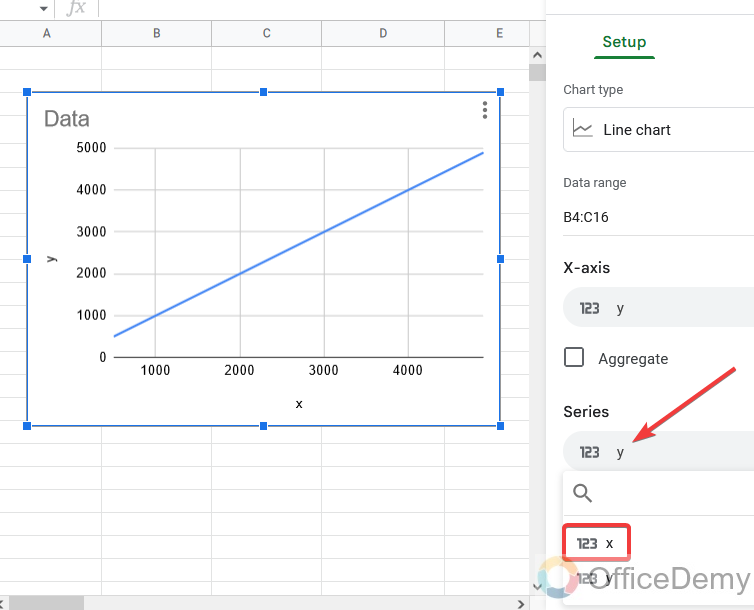
Step 12
So here I am selecting the data of “x” to be displayed on the y-axis.
Step 13
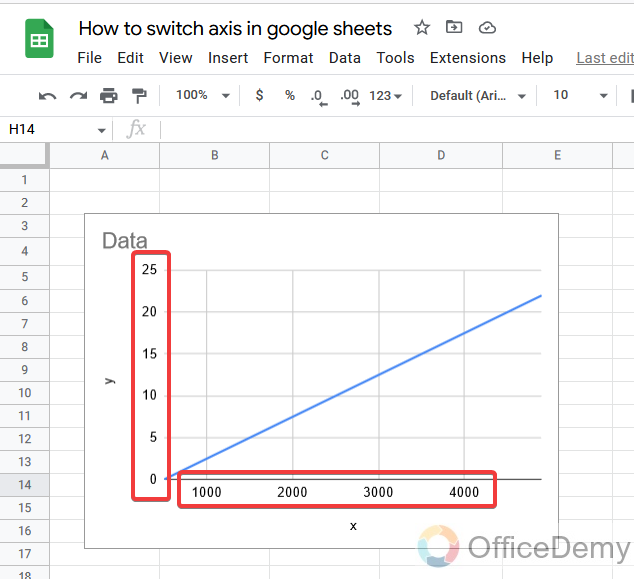
In this manner, you can switch axes in Google sheets. As you can see in the following picture the data which was displayed on the x-axis is now on the y-axis and similarly, on the y-axis, there is data on the x-axis.
Frequently Asked Questions
Q: Can I Add Axis Labels in Google Sheets After Switching the Axis?
A: Yes, you can add axis labels in google sheets after switching the axis. Simply locate the desired axis on your chart, right-click on it, and select Edit Axis. From there, you can input your desired label in the designated field. Adjust as needed and your axis labels in Google Sheets will be updated accordingly.
Q: How to Move the Y-Axis to the Right Side in Google Sheets?
A: As you may know, in Google Sheets, the vertical axis (y-axis) is by default placed on the left side of the chart. It’s common in other spreadsheet applications too. But if you want, you can move the vertical axis to the right side in Google Sheets. Just some people don’t have to do this for different looks of the chart so you can move your y-axis to the right side of the chart by following the steps.
Step 1
As you can see in the following picture, the y-axis is on the left side of the chart. If you want to move the y-axis to the right side of the chart. Click on the chart.
Step 2
Three dots will appear on the right top of the chart, click on it and then click on the “Edit chart” option from the menu.
Step 3
A side pane menu will open at the right side of the window where you go into the “customize” mode and then go into the “Series” from the following options.
Step 4
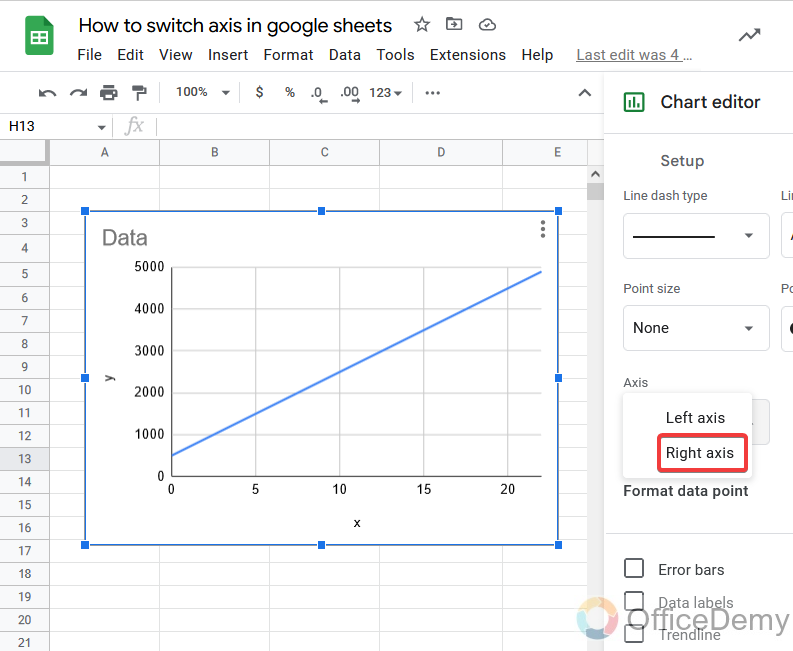
There will be an option for the axis which is currently on the left as you can see in the picture. To change the side of the axis click on this option.
Step 5
When you click on this option, it will ask for the right and left sides of the axis. Select the right side for the axis, so the y-axis will move towards the right side of the chart.
Step 6
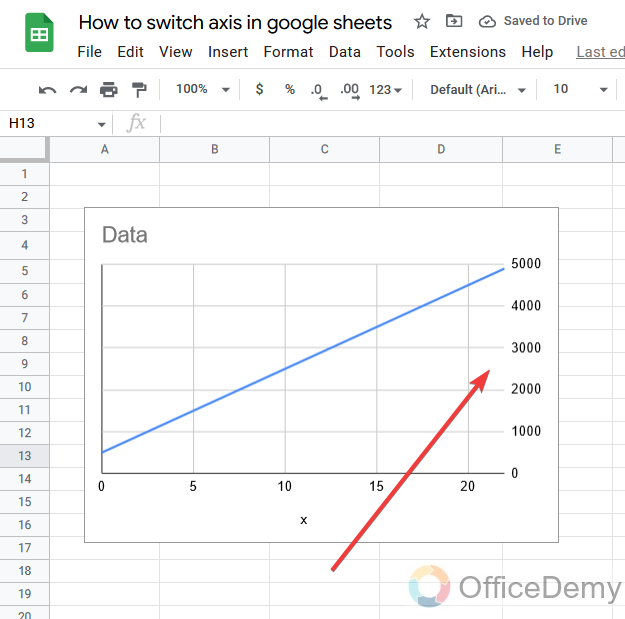
As you can see now, the y-axis data has been transferred toward the right side of the chart.
Q: How to label the axis of the chart in Google Sheets?
A: Axis labels are the text labels that appear along the horizontal and vertical axes of a chart. They can be used to indicate the units of measure for the data plotted on the chart or to provide descriptive text about the data. Axis labels are computed based on the data displayed in the chart. Axes labels provide vital reference information for users to associate data points with values, especially when data points are not labeled directly in a chart. Do you want to give names to your axes? Then read the following steps.
Step 1
Click on the chart, and three dots will appear at the right top of the chart, click on it, and a menu dialogue box will open, and click on “Edit chart“.
Step 2
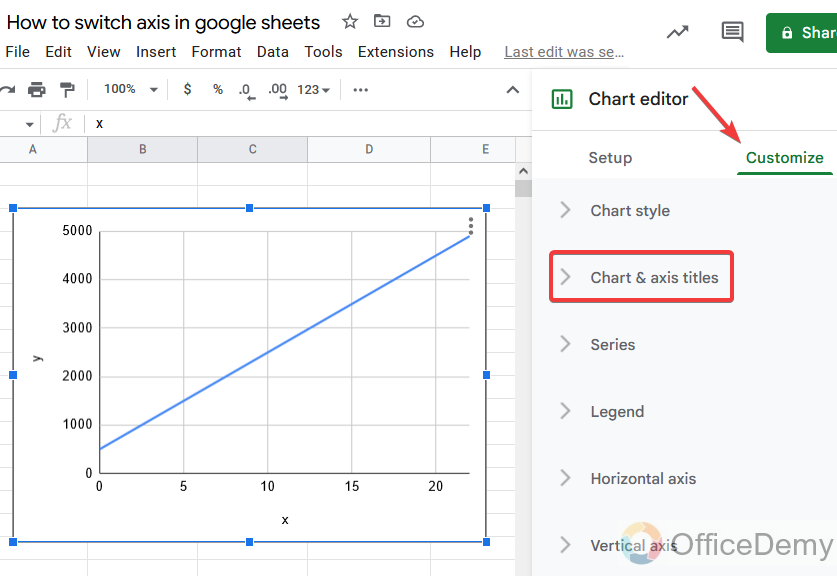
A chart customization pane menu will open on the right side of the Google sheets, Go into the customize mode, and click on the “Chart and axis titles“.
Step 3
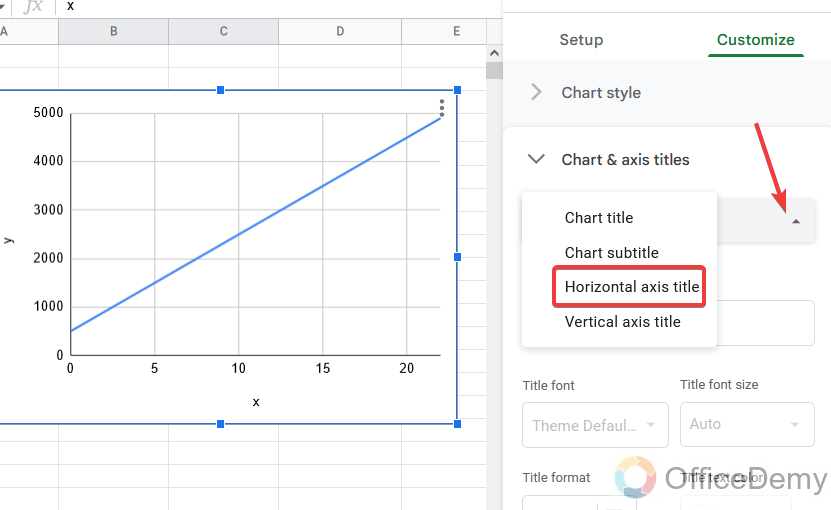
At the first option click on this small arrow to choose the axis to give the title. Here I am choosing the x-axis first to give the name.
Step 4
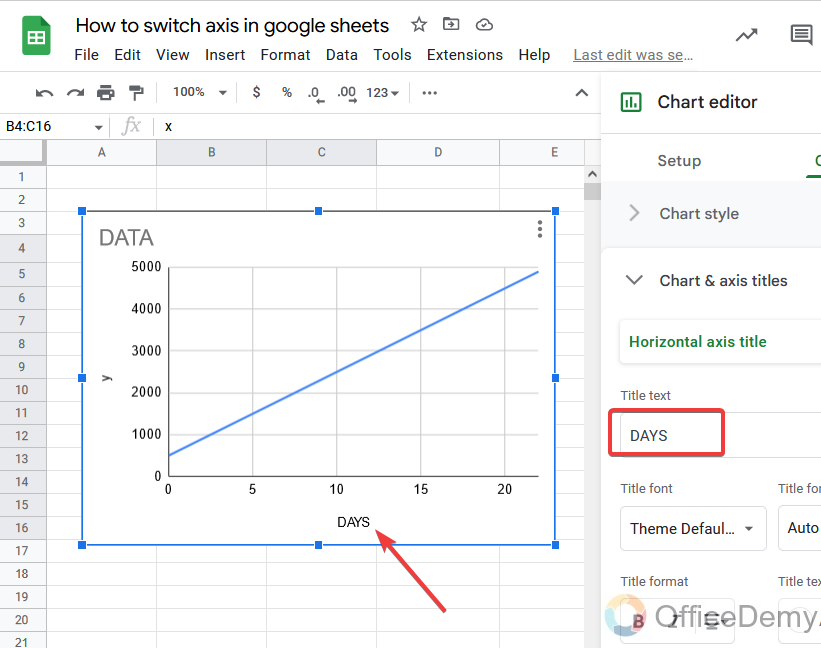
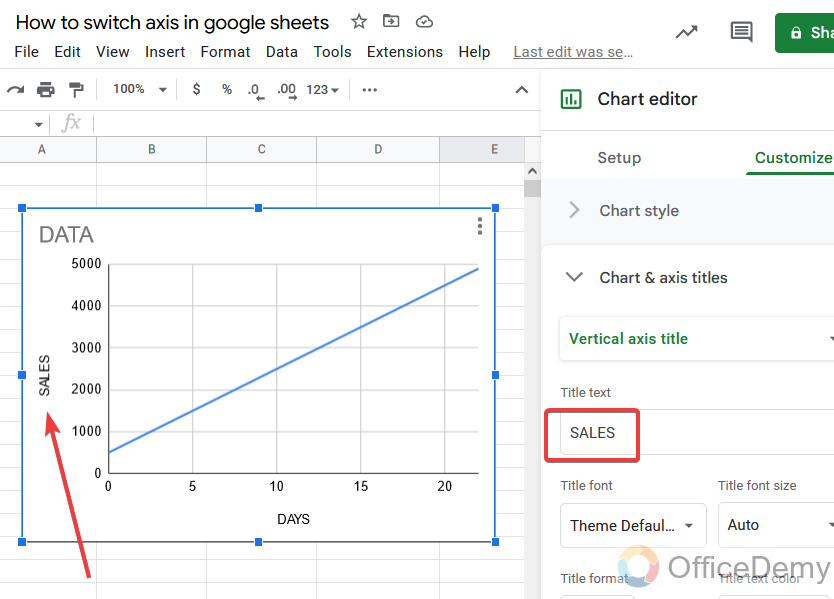
Then in the next section in the pane menu write the name of your axis in the title text box. Your axis will be labeled with the name you wrote as shown in the following picture.
Step 5
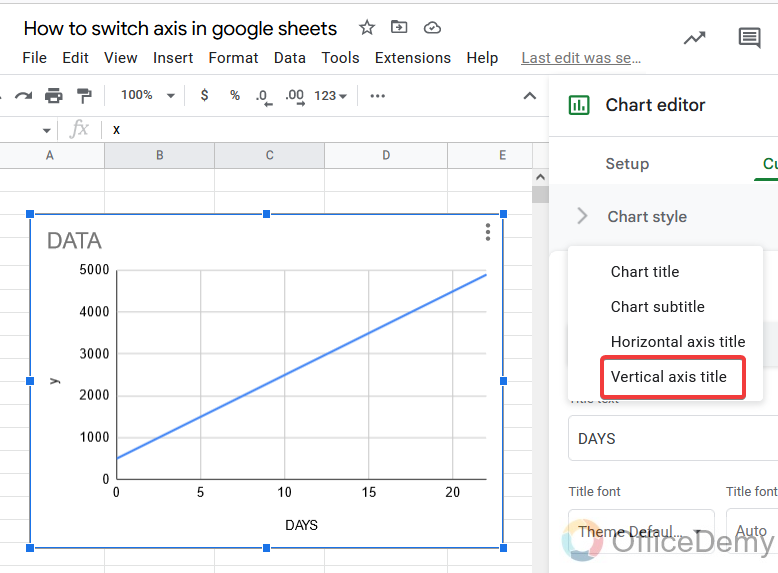
Now similarly, I will choose the y-axis to give its name from the above menu as we did in the previous step.
Step 6
Then give it a name whatever you want to give it. Your axis title will be displayed in the chart.
Q: Does swapping columns affect the Chart Axes in Google Sheets?
A: Yes! It will affect. Infect not only by swapping columns but by making any kind of change can affect your chart in Google Sheets. So, be careful while editing or customizing your data, it will make changes in charts or graphs as well.
Conclusion
This tutorial showed you how to switch axis in Google Sheets charts and graphs. But we also told you the way of inserting charts in google sheets. We tried to keep the tutorial simple and to the point and described every step in detail. We hope you found it useful and easy to follow. Don’t forget to give your feedback to us in the comment section to support the Office Demy team.


