
To Draw the Cantor Set in Google Sheets
- Place “1” in cell A1.
- In cell B1, enter a formula to create data for the first ten Cantor Set pattern iterations.
- Create a new sheet named “Cantor Set” for visualizing the pattern.
- Employ formulas to generate row numbers, corresponding column letters, and open-ended range references to the “Data” sheet.
- Utilize Google Sheets’ sparkline formulas to visualize the Cantor Set pattern.
This article will teach you how to draw the Cantor Set in Google Sheets. By following this article, you’ll gain hands-on experience in using conditional formatting to construct the Cantor Set’s distinctive pattern, enriching your knowledge of both math and spreadsheet software.
Drawing the Cantor Set in Google Sheets is like creating a special pattern using numbers in a computer program. The Cantor Set is a very interesting math idea that makes a special kind of shape. It’s like a puzzle because it looks the same, no matter how close or far you look at it.
By using the basic tools provided by Google Sheets, we can create a visual representation of this infinitely complex structure. This process will not only deepen your understanding of mathematical constructs but also demonstrate the versatility of Google Sheets as a tool for visualizing abstract concepts. So, let’s start this article by exploring the beauty and intricacy of the Cantor Set within the familiar confines of Google Sheets.
Advantages of the Cantor Set in Google Sheets?
Learning how to draw the Cantor Set in Google Sheets is important for several reasons. This exercise sharpens your understanding of self-similarity and fractal geometry while honing your skills in conditional formatting and data manipulation. Firstly, it introduces us to the captivating world of fractals, intricate patterns found in nature and mathematics. This knowledge helps us see the hidden complexities in seemingly simple shapes. Secondly, mastering Google Sheets for this task enhances our computational abilities, providing a practical skill applicable to various fields.
It also encourages problem-solving and critical thinking, breaking down complex concepts into manageable steps. Moreover, it transforms abstract ideas into a tangible, interactive experience, making math engaging and enjoyable. Ultimately, this exercise goes beyond drawing a pattern; it fosters a deeper appreciation for the beauty of mathematics and equips us with valuable skills for the real world.
Step-by-Step Procedure – How to Draw the Cantor Set in Google Sheets
In this article, we will show you the step-by-step procedure of how to Draw the Cantor Set in Google Sheets. Following are the steps.
STEP 1
In a blank sheet, type the number “1” into cell A1 in Google sheet.
STEP 2
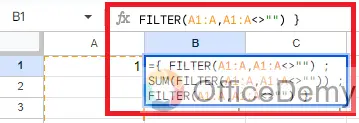
In cell B1, type this formula:
={ FILTER(A1:A,A1:A<>””) ;
SUM(FILTER(A1:A,A1:A<>””)) ;
FILTER(A1:A,A1:A<>””) }
STEP 3
The data is created for the first 10 times when you drag this across your sheet up to column J.
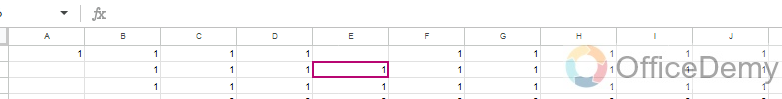
Each formula refers to the leftmost column. For instance, column C will be mentioned in the formula in cell D.
STEP 4
Create a new blank sheet and call it “Cantor Set”.
STEP 5
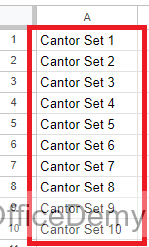
Put this formula in cell A1 and copy down the column to row 10:
=”Cantor Set“&ROW()
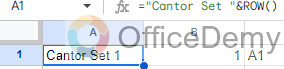
This creates a string, e.g. “Cantor Set 1”, where the number is equal to the row number we’re on.
STEP 6
The range reference will then be generated dynamically. To retrieve the right data for this iteration of the Cantor set, we want our formula to go across the row in the “Data” tab as we drag it down column B.
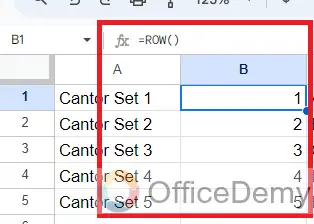
Start by using this formula in cell B1 to generate the row numbers for each row, then copy that formula down the column:
=ROW()
STEP 7
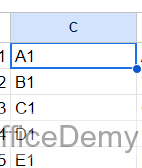
With this formula in cell C1, you may use the row number to generate the corresponding column letter, and then copy the column down.
=ADDRESS(1,ROW(),4)
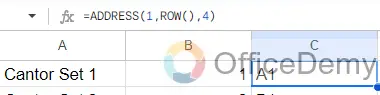
The cell reference is returned as a string using the ADDRESS function in this case.
STEP 8
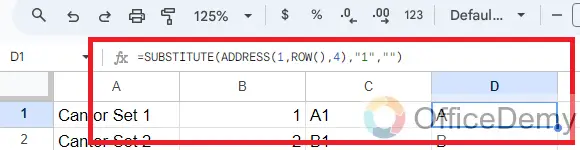
Remove the row number with this formula in cell D1 using this formula
=SUBSTITUTE(ADDRESS(1,ROW(),4),”1″,””)
Copy down the column:
STEP 9
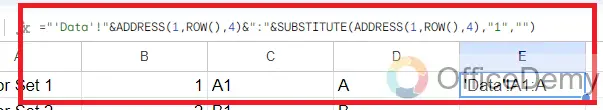
To generate an open-ended range reference for the appropriate column of data in the “Data” sheet, combine these two references.
Enter the following formula in cell E1 and repeat it down the column:
=”‘Data’!”&ADDRESS(1,ROW(),4)&”:”&SUBSTITUTE(ADDRESS(1,ROW(),4),”1″,””)
STEP 10
Put this formula in cell F1 and copy down the column:
=INDIRECT(“‘Data’!”&ADDRESS(1,ROW(),4)&”:”&SUBSTITUTE(ADDRESS(1,ROW(),4),”1″,””))
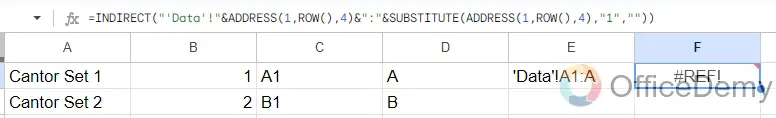
This will show #REF! errors: “Array result was not expanded because it would overwrite data in…”
However, don’t worry, these are only temporary as we will dump this data into the sparkline formula next.
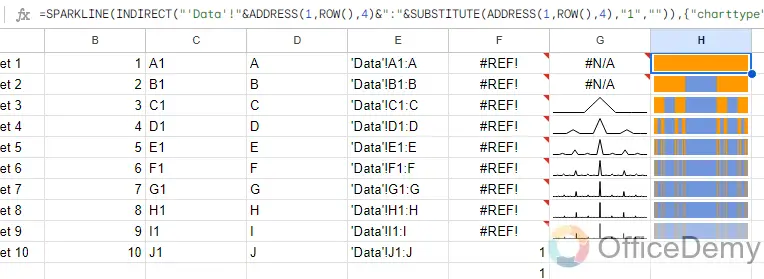
STEP 11
In column G, create a default sparkline formula:
=SPARKLINE(INDIRECT(“‘Data’!”&ADDRESS(1,ROW(),4)&”:”&SUBSTITUTE(ADDRESS(1,ROW(),4),”1″,””)))

This shows the default line chart (except for the first row where it shows a #N/A error).
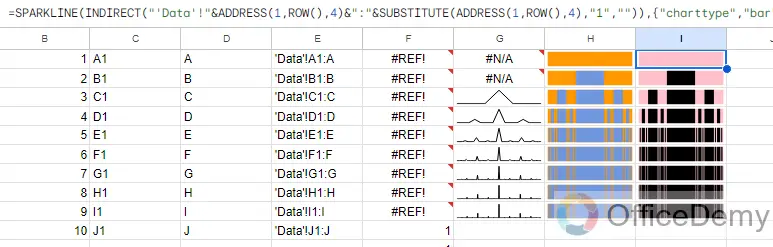
STEP 12
In column H, convert the line chart sparkline to a bar chart sparkline by specifying the chart type in custom options:
=SPARKLINE(INDIRECT(“‘Data’!”&ADDRESS(1,ROW(),4)&”:”&SUBSTITUTE(ADDRESS(1,ROW(),4),”1″,””)),{“charttype”,”bar”})
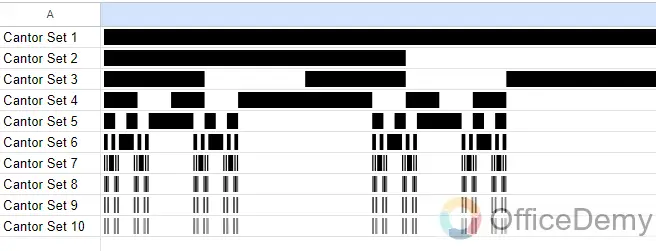
STEP 13
Finally, in column I, change the colors to a simple black-and-white scheme, by specifying the color1 and color2 inside the sparkline:
=SPARKLINE(INDIRECT(“‘Data’!”&ADDRESS(1,ROW(),4)&”:”&SUBSTITUTE(ADDRESS(1,ROW(),4),”1″,””)),{“charttype”,”bar”;”color1″,”pink”;”color2″,”black”})
Final View:
How to Draw the Cantor Set in Google Sheets – FAQs
What is the Cantor Set, exactly?
The middle thirds of a line segment are repeatedly eliminated to create the mathematical set of points known as the Cantor Set. It displays self-similarity at many scales, making it a typical example of a fractal.
Why should I draw the Cantor Set in Google Sheets?
To better comprehend the Cantor Set’s recursive construction, it can be helpful to visualize it using Google Sheets. It’s also entertaining to use a known instrument to investigate mathematical ideas.
How can I get access to Google Sheets?
By visiting the Google Drive website (drive.google.com), logging in with your Google account, and then creating a new spreadsheet, you can access Google Sheets.
Can I draw the Cantor Set using a specific formula?
Although Google Sheets formulas can’t be used to directly draw geometric objects like the Cantor Set, you may use conditional formatting and cells to get a visual depiction.
Can I alter the number of iterations to obtain a Cantor Set with additional specifics?
It is possible to get a more accurate approximation of the Cantor Set by increasing the number of iterations. To make more sub-segments, just repeat the process of separating and copying the segments.
Is the number of iterations I can perform in Google Sheets limited?
No, there isn’t a hard cap on the number of iterations, performance may start to suffer if your Google Sheets spreadsheet contains a very large number of rows and columns.
Can I automate the process of drawing the Cantor Set in Google Sheets?
While Google Sheets doesn’t have a built-in function for generating the Cantor Set, you can use formulas and conditional formatting rules in combination to approximate its appearance.
Conclusion
Wrapping up how to draw Cantor set in Google Sheets. It offers a practical and straightforward approach to understanding this fascinating mathematical idea. Users can display the recursive division of line segments by utilizing conditional formatting and cell operations, producing a rudimentary but instructive visual representation of the Cantor Set’s self-similarity. For more similar topics, please visit Office Demy. Thanks for reading!

