
To Make a Funnel Chart in Google Sheets
- Select data range.
- Insert Funnel Chart from Insert tab.
- Open Chart Editor.
- Change the chart type to a Stacked bar chart.
OR
- Go into the Extensions tab and click on Get add-ons.
- Search and install the “Chart, Graphics & Visual by Chart Expo“.
- Open the tool.
- Select the funnel chart to add.
- Fulfil the requirements and click on the Create button.
- Click on the “Add to Sheet” button.
Today we will learn how to make a funnel chart in Google Sheets. Who denied that charts can represent data visually as the best way to analyze, monitor, or read data? Similarly, one type of chart Funnel chart is also the most useful feature to represent the data. But unfortunately, Google Sheets does not have a native option to insert a funnel chart in Google Sheets, but you don’t need to worry, because we have found a way to make a funnel chart in Google Sheets. Go through the following guide on how to make a funnel chart in Google Sheets and make your funnel chart in Google Sheets with easy steps.
Why do we need Funnel Charts in Google Sheets?
A funnel chart can be defined as an inverted pyramid-like shape that can show linear, interconnected processes. It is also used to show the progress of stages in a specific procedure. In the funnel chart starting numbers are tracked through each stage that are useful in business, school, and sales. Let’s move towards the next section of how to make a funnel chart in Google Sheets to learn its procedure.
How to Make a Funnel Chart in Google Sheets
In this tutorial on how to make a funnel chart in Google Sheets, we will learn two different methods of making a funnel chart in Google Sheets. Now it’s up to you which method you prefer most.
- Funnel chart by Google Sheets Chart option
- Funnel chart by Google Sheets add-ons
1. Funnel Chart by Google Sheets Using Chart option
In this method, we will use a simple built-in Chart option to mark a funnel chart in Google Sheets, you easily insert a funnel chart in Google Sheets from the Insert tab, below are the steps to make a funnel chart in Google Sheets by built-in chart option.
Step 1
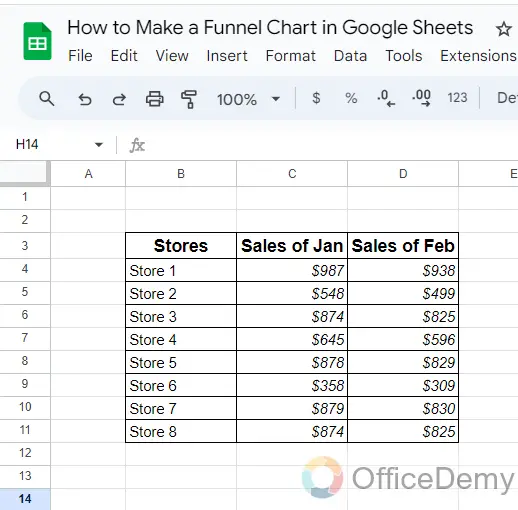
Here, we see in the following example, that we have a dataset of sales of two different months of different stores. Let’s see how to make a funnel chart for the following data.
Step 2
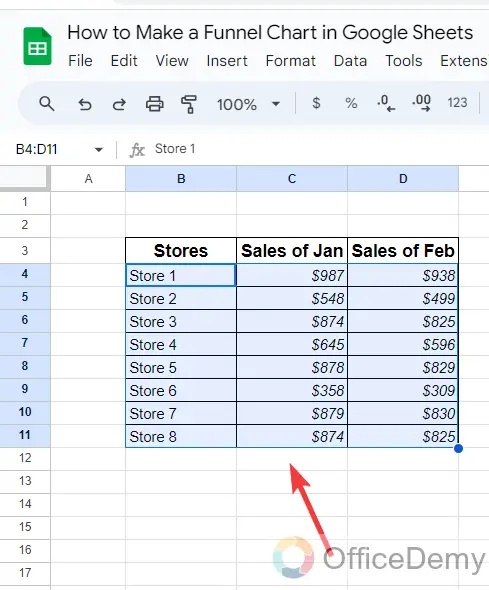
To make a funnel chart in Google Sheets, the first thing you will need to do that, select all the data of which we are making a funnel chart in Google Sheets as I have selected below.
Step 3
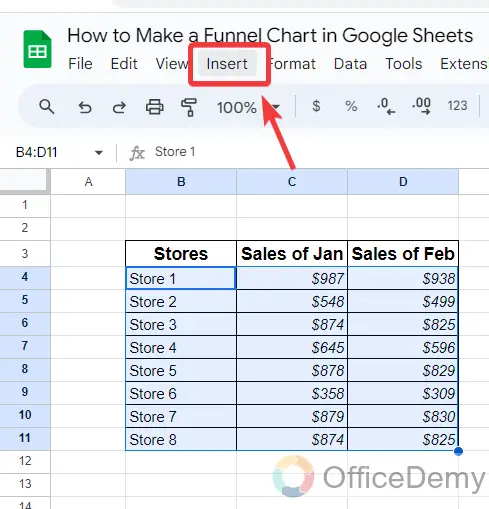
Once you have selected the data range, to insert the chart in Google Sheets, go into the “Insert” tab of the menu bar of Google Sheets as highlighted below.
Step 4
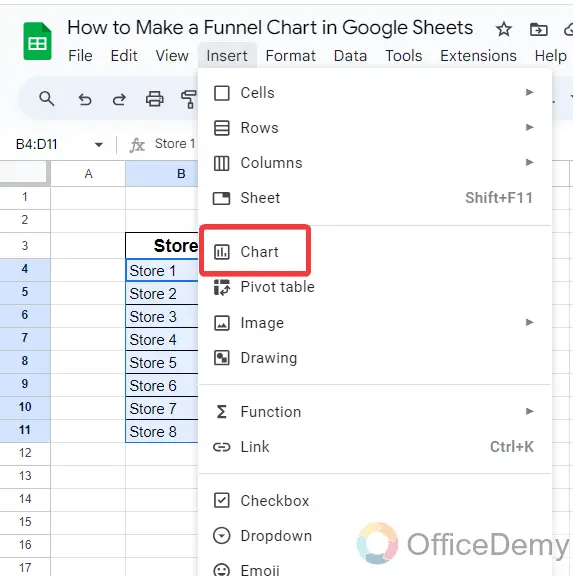
When you click on the “Insert” tab from the menu bar, a drop-down menu will open where you will see a “Chart” option through which you can insert a chart in Google Sheets.
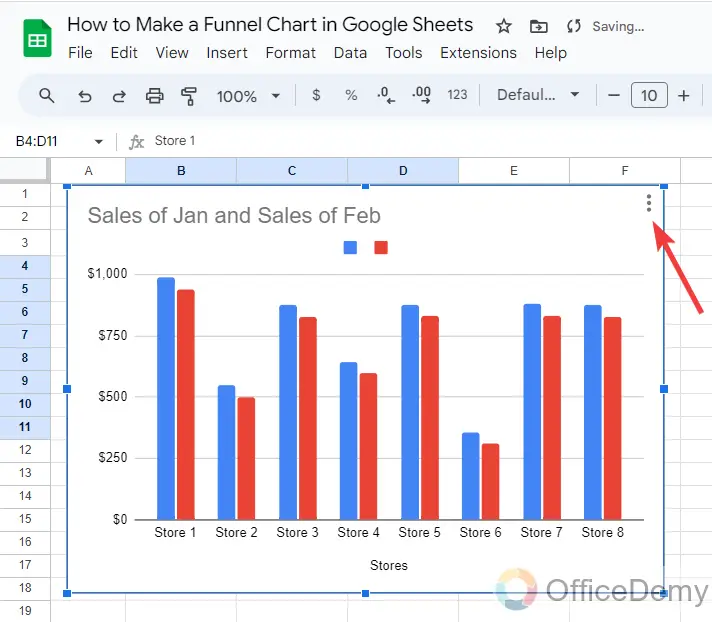
Step 5
When you click on the “Chart” option, your chart will instantly be inserted into your Google Sheets as you can see in the following picture, but this is not a funnel chart. To change the Chart type, click on the three dots option at the right top corner of the Chart.
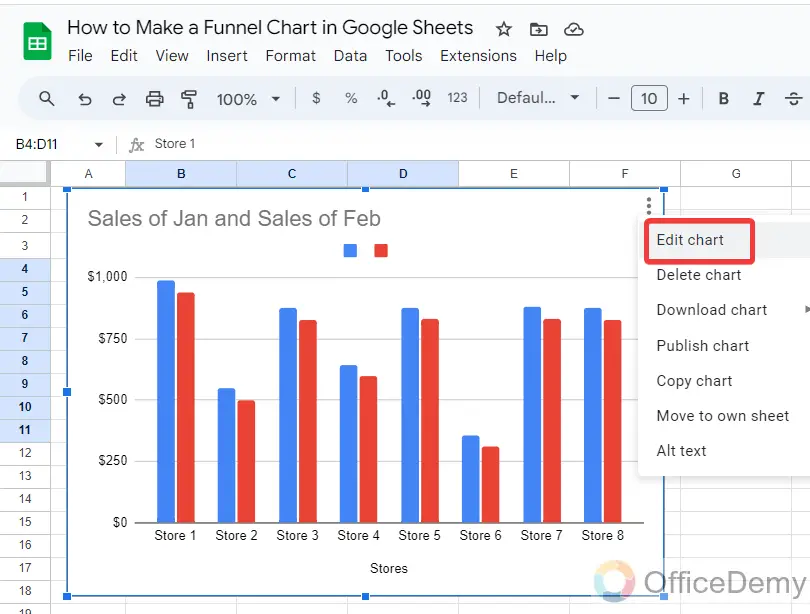
Step 6
When you click on this three dots option, a drop-down menu will open, click on the “Edit chart” option as highlighted below.
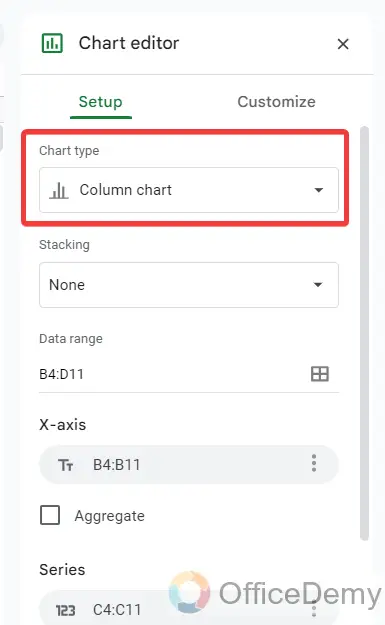
Step 7
Clicking on the “Edit chart” option will give you a pane menu at the right side of the window, on this panel you will find the “Chart type” option through which you can change the chart type.
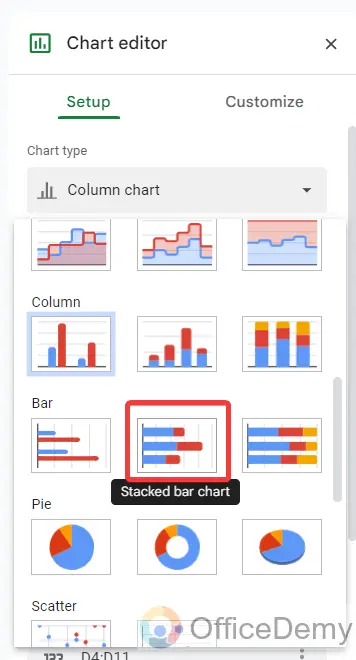
Step 8
When you click on this chart type option, a drop-down menu will open, select the “Stacked bar” chart from the gallery.
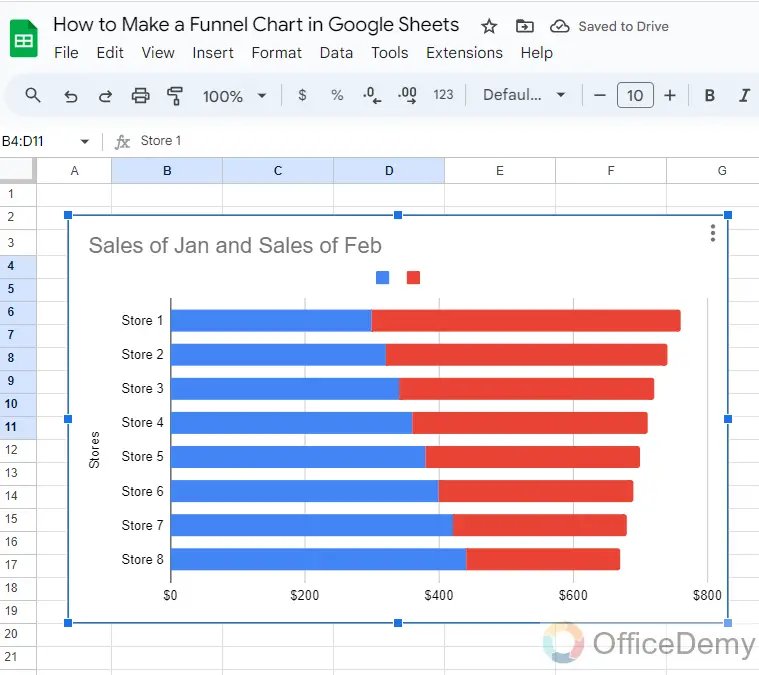
Step 9
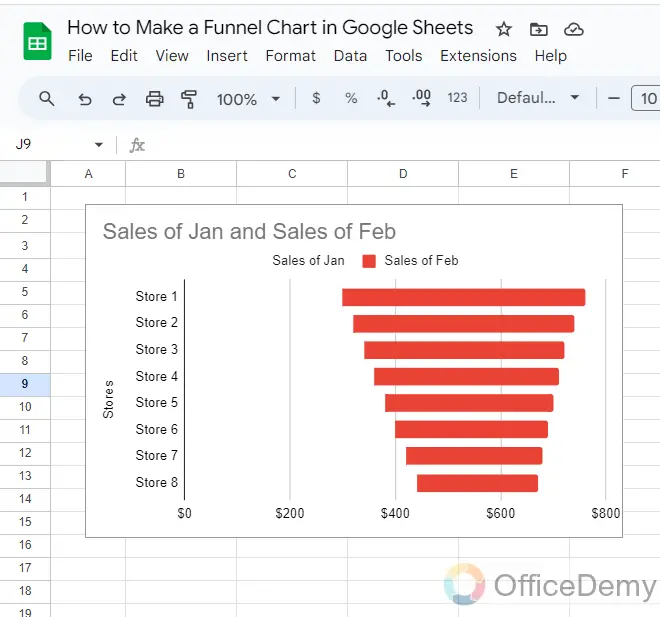
Now, if you see in the following picture, the chart has been converted into a stacked bar in which you assume the red bars as a funnel chart in Google Sheets.
2. Funnel chart by Google Sheets Add-ons
Although Google Sheets has enough features to make any task possible, Google Sheets still has additional tools to accomplish these tasks more professionally. Similarly, it has an add-on for making a chart namely “Chart, Graphics & Visual by Chart Expo” through which you can easily make a more attractive funnel chart in Google Sheets with the help of following easy steps.
Step 1
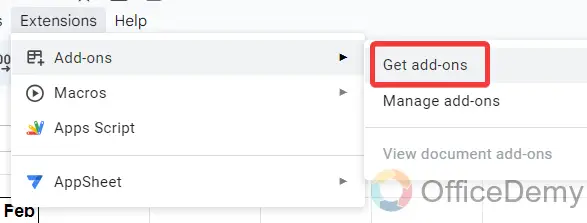
To get add-ons, go into the Extensions tab of the menu bar of Google Sheets, then click on the “Add-ons” option from the drop-down menu, another menu will expand where you will see the “Get add-ons” option as highlighted below.
Step 2
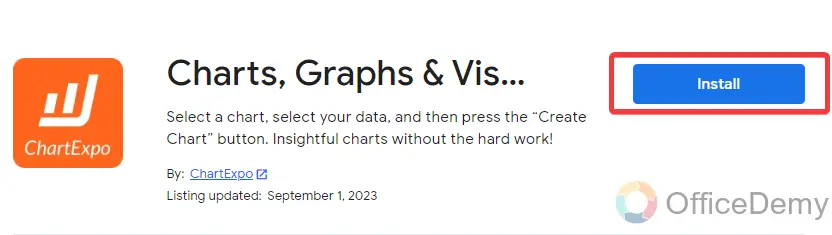
When you click on the “Get add-ons” option, a new separate window will open, search for the “Chart, Graphics & Visual by Chart Expo” and install this add-on into your sheet
Step 3
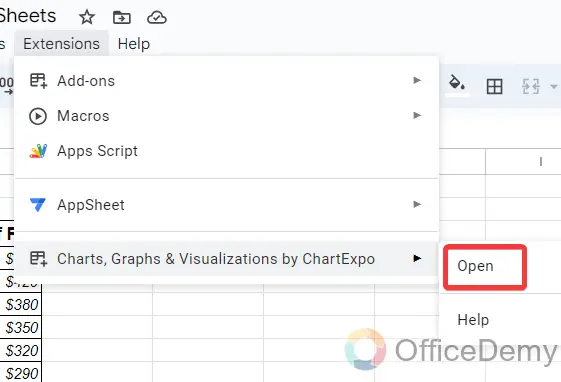
Once you have completed the installation of tools, access it to open it from the Extensions tab as directed in the following picture.
Step 4
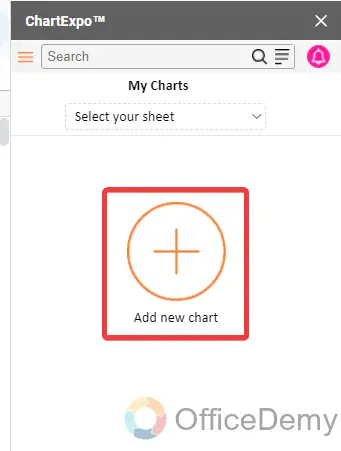
Your add-ons will be started with the following pane menu at the right side of the window, click on the “Add new chart” button.
Step 5
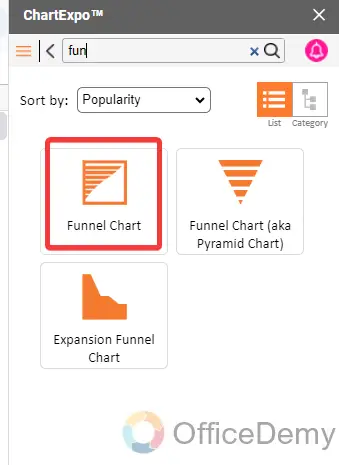
When you click on the “Add new chart” button, different kinds of charts will be in front of you, search for “Funnel chart” and select it to insert.
Step 6
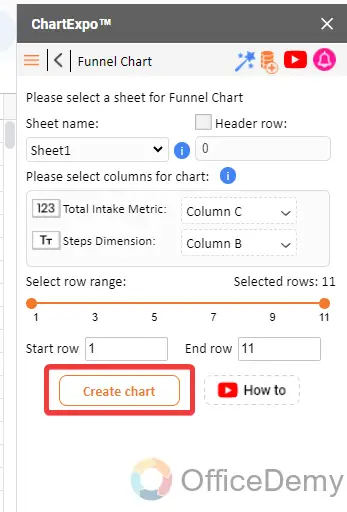
Give the required information like Sheet reference, data range, metric and dimensions then click on the “Create” button.
Step 7
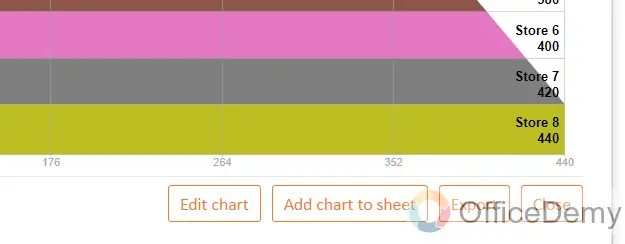
A sample chart will be displayed in front of you, click on the following actions that you want to do, if you want to add to the sheet then click on the “Add chart to sheet” button.
Step 8
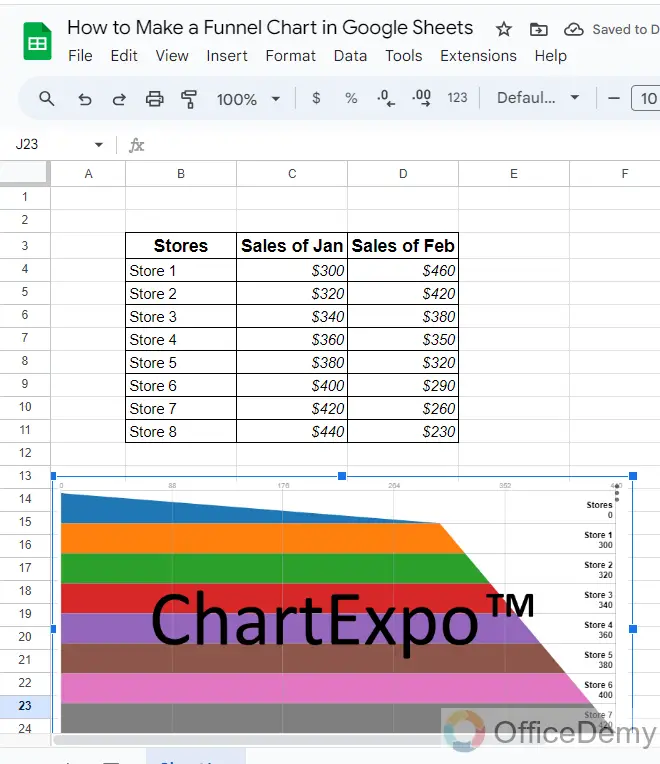
The result is in front of you, you can see the below, funnel chart has been inserted into the sheet.
Frequently Asked Questions
Can’t we remove the helping bar of the funnel chart in Google Sheets?
As we all know that Funnel chart consists of the shape of a pyramid, while in a stacked bar chart in Google Sheets there are also present the distance between the start of the chart and by blue bars, how can we remove these blue bars from the chart to make a pure funnel chart in Google Sheets.
Step 1
Let’s suppose, your observed values are giving you the following Funnel chart in Google Sheets, then to make a pyramid first open the Chart editor by clicking on the following “Edit chart” option.
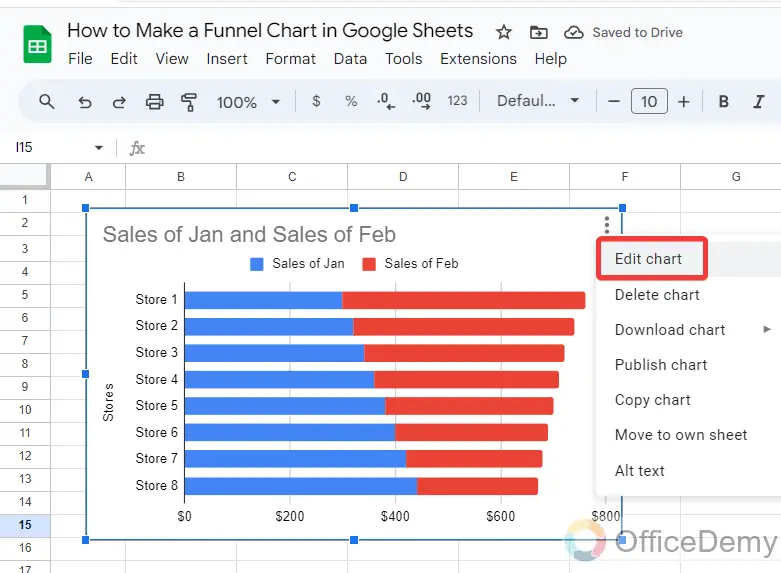
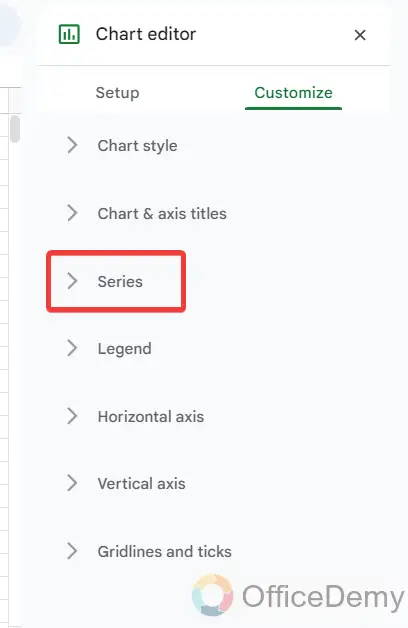
Step 2
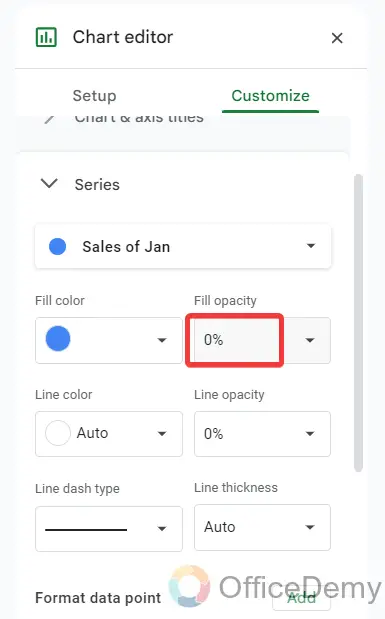
In the chart editor, go into the Customize tab, then click on the “Series” option as highlighted below.
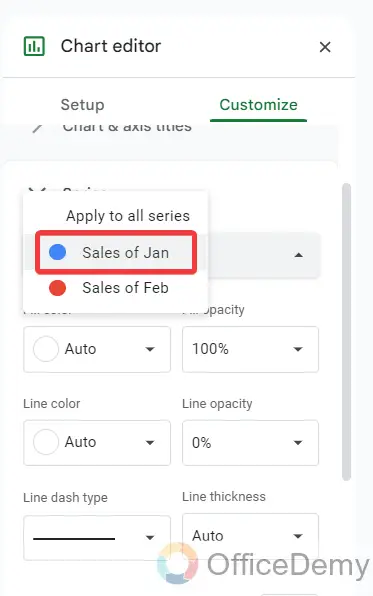
Step 3
First, you will see a drop-listed menu, select any one of the series that you want to hide in your funnel chart, as here I am hiding the “Sales of January“.
Step 4
After selecting one of the series of charts, make its transparency “0%” by the following option as highlighted in the following screenshot.
Step 5
It would give you the following result as you can see in the following picture, the Funnel chart has been converted into a pyramid chart as shown below.
How to Export a Funnel Chart in Google Sheets?
Once you have created a funnel chart in Google Sheets, you may need to export it to share or to print, etc. Then don’t worry, Google Sheets gives you the facility of exporting your chart in different formats as well. Follow the following instructions to export a chart in Google Sheets.
Step 1
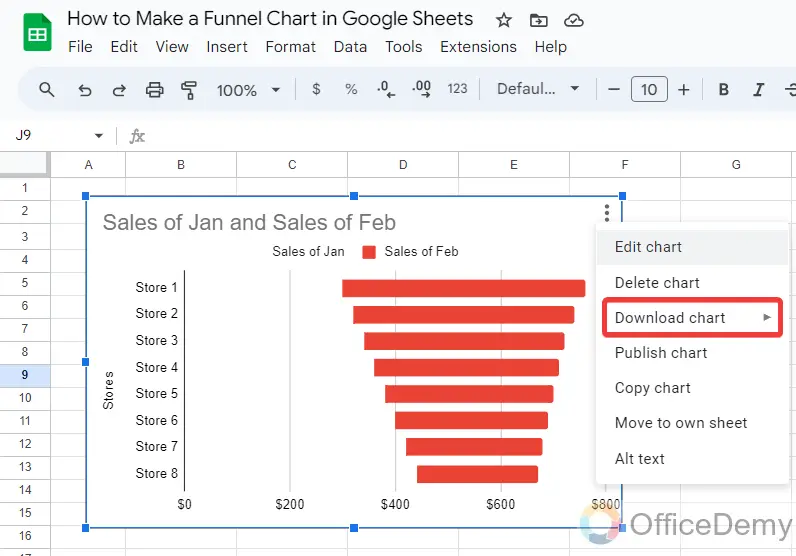
Once your chart has been inserted into Google Sheets, to export or download this chart, click on the three dots option, you will find a “Download” option in the drop-down menu.
Step 2
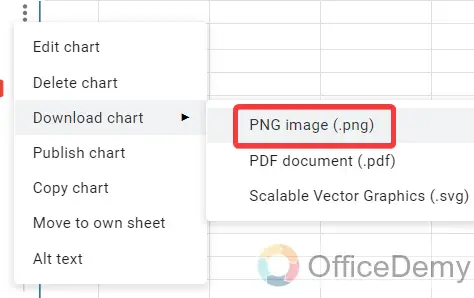
When you click on this “Download” option, another menu will expand where you will see different kinds of file formats in which you can download your funnel chart, as here I am selecting PNG file format, so the chart will instantly export into PNG.
Conclusion
Hopefully, Google will soon announce the feature of funnel charts in Google Sheets, till then you can take advantage of the above guide on how to make a funnel chart in Google Sheets to make a funnel chart in Google Sheets.

