To Get Started with Google Data Studio Tutorial
Access Google Data Studio.
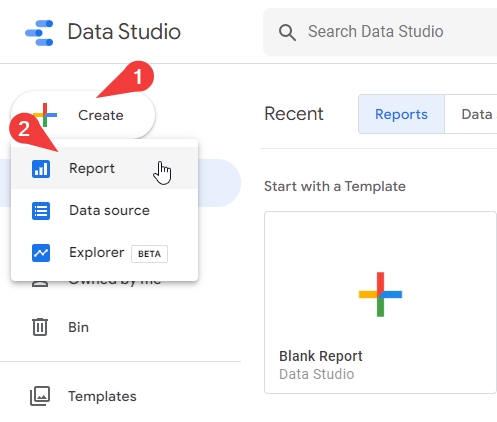
- Click “Create” > “Report“.
- Connect a data source from various options.
- Select and connect the desired data source.
- The data fields can be edited/customized for your requirements.
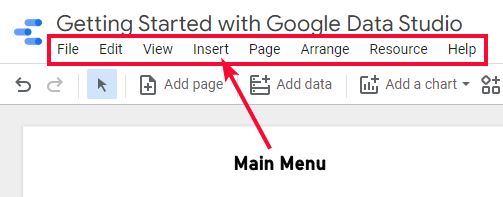
Google Data Studio Toolbar:
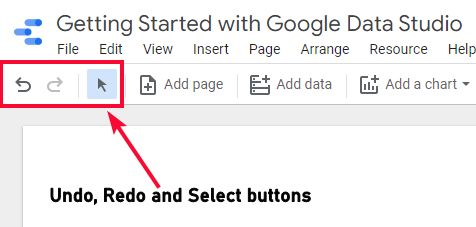
- The toolbar on the left includes Select, undo, and redo buttons.
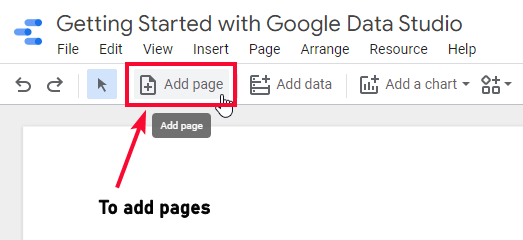
- The “Add page” allows adding multiple pages to a report.
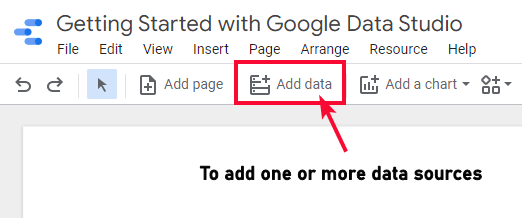
- The “Add data” connects additional data sources.
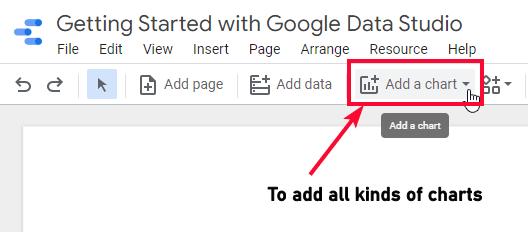
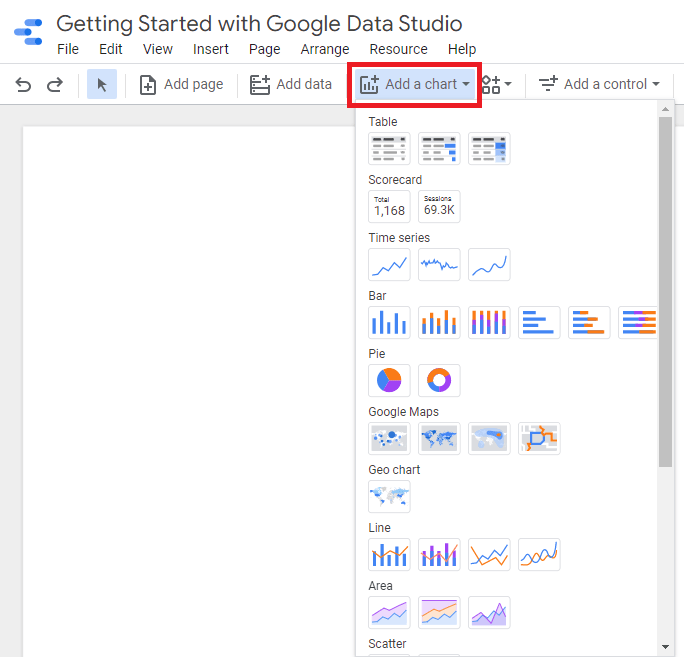
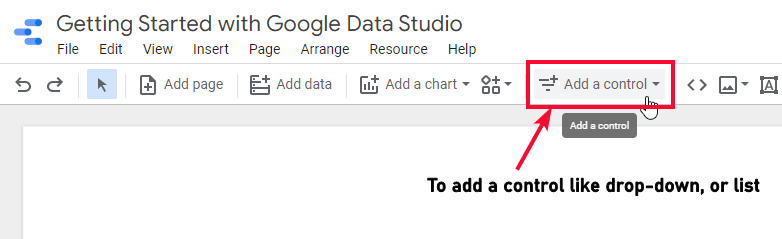
- The “Add Chart” and “Add Control” provide various chart and control options.
- The “Add link,” “Add image,” “Add text,” “Line,” and “Shape” tools for adding elements to the canvas.
Hi. Welcome to the brand-new series of tutorials on Google Data Studio, today we are going to learn the fundamentals of Google Data Studio which is a very handy tool to create amazing reports. Nowadays, the data analytics and dashboard design markets are very fragmented and you have tons of solutions around for you that have pros and cons. Usually, you have to choose between heavy BI tools which allow you to do anything but they cost a huge amount every year, but here are some excellent tools available that do not cost anything and can do everything for you quite easily.
Yes, fortunately, we have Google Data Studio here getting popularity among digital marketers, business managers, UX designers, and dashboard designers. Google Data Studio allows us to create and share beautiful reports fast and smartly. Google Data Studio is an ideal data visualization and report creation tool for small and medium-sized businesses, and even for a department of a big organization. So, let’s see how, here we are getting started with Google Data studio.
Why do we need to learn Google Data Studio?
A question may arise in your curious mind that why Google Data Studio is here, every tool like Google Sheets, Google Docs, and many others have built-in features to create infographics, reports, and charts very smartly. When you talk about the most common YouTube platform, there is a tool called YouTube analytics that automatically creates your data reports and you can visually see and analyze your channel performance and compare top and less performing videos, then why Google Data Studio, well Google Data Studio allows you to customize your reports, add your brand colors in the report, add your custom data fields, compare any data with any other data over any time.
So, you can do anything with your data that is not possible in any other tool like Sheets, and Docs. And, normally the built-in reports section always shows the same pattern of data, the big data is always on top and there is no custom comparison of data, on the other end, Google Data Studio allows you to perform any kind of calculation and display like a dashboard with your custom colors and branding style.
That’s why we have Google Data Studio we need to learn it to make customized and fully functional reports for any platform you can think of. Google Data Studio can create reports for Facebook page, Twitter Page, Facebook and Twitter ads, YouTube, Amazon, Google My Business, Yahoo, Vimeo, Bing Ads, Google Sheets, LinkedIn, Salesforce, Tumblr, Twilio, Trip Advisor, and any custom data in any format.
Basic Components of Google Data Studio Reporting Tool
We need to understand the important sections we have got in Google Data Studio to understand how it works, the workflow is pretty simple, you have a simple home page like any other tool and you can work around using the main menu and toolbar. But this is not the entire overview, let’s see the components of Google Data Studio from scratch. Firstly we will see how to connect a data source, then we will learn about the toolbar.
Getting Started with Google Data Studio – Connect to a Data Source
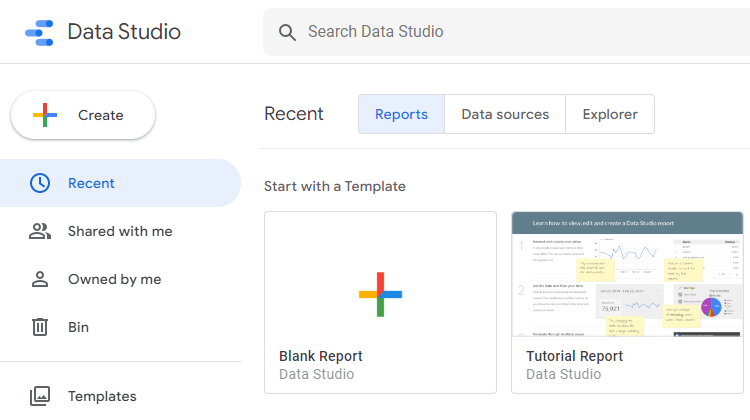
You need to go to https://datastudio.google.com/ to get started with your google account.
You see a simple dashboard here with some starter reports to get started. Here, we first need to have a data source and connect with Google Data Studio to start working on the dashboard. So, let’s connect a data source.
Step 1
Go to the above link to get to the Homepage of Google Data Studio
Step 2
Click on Create button > Report
Step 3
Google Data Studio will ask you to connect a data source before taking you to the actual blank file.
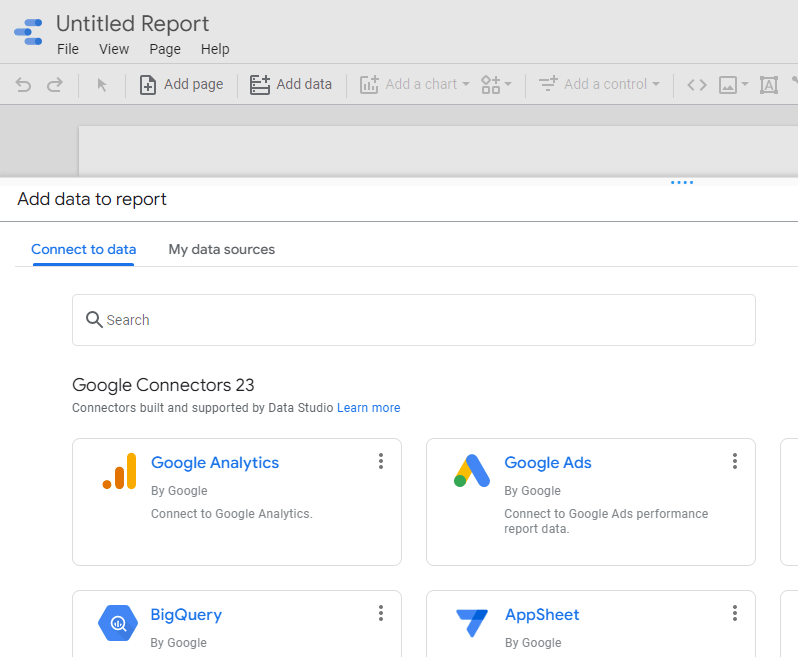
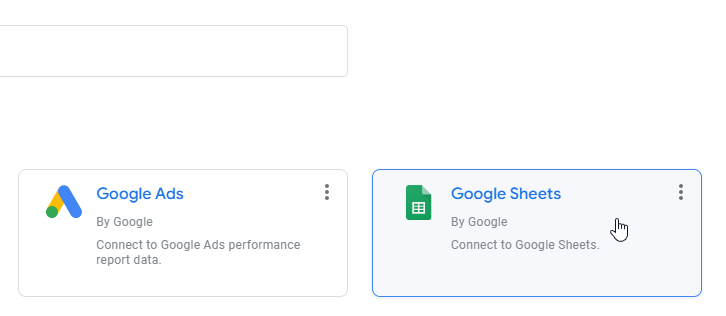
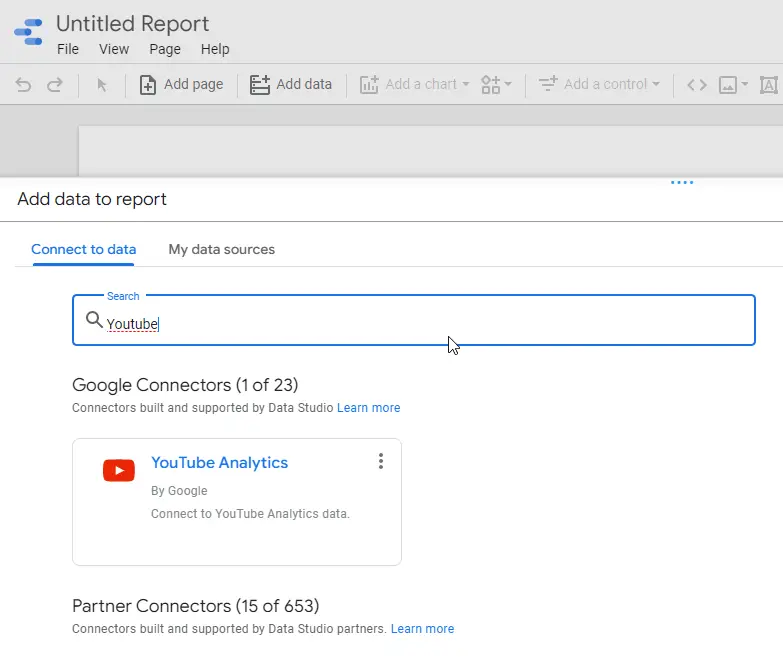
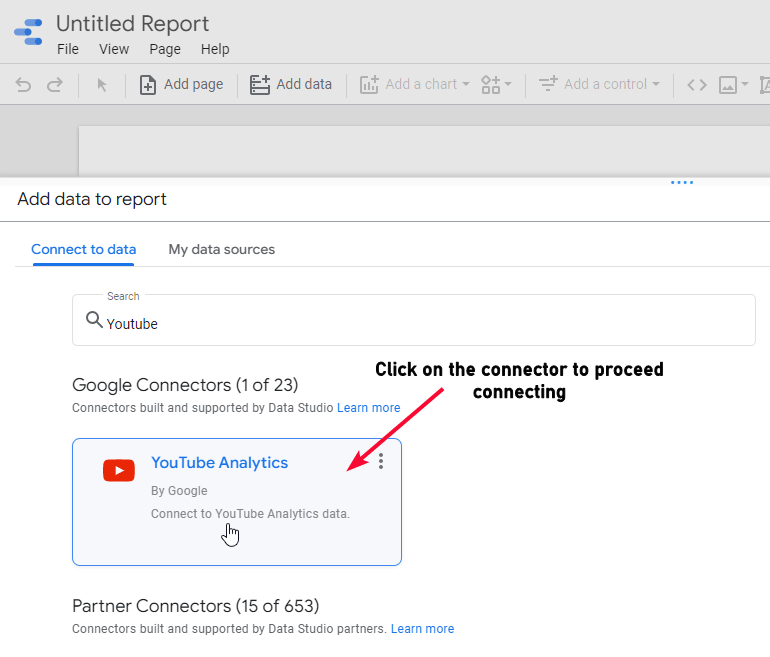
Below you have so many data sources supported by Google Data Studio, you can click to select a source, or simply you can use Google Sheets to keep things simple and familiar. Here I am going to use the YouTube analytics connector to make a report
Step 4
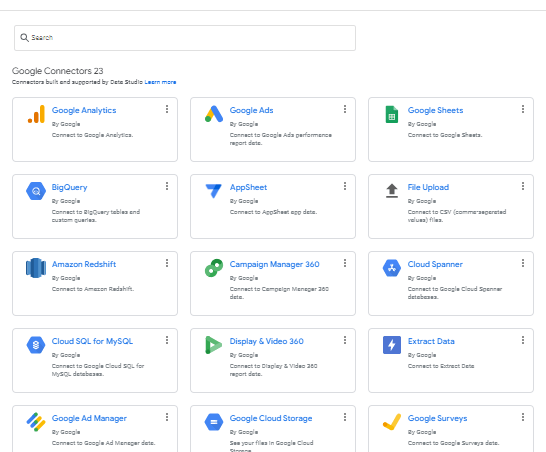
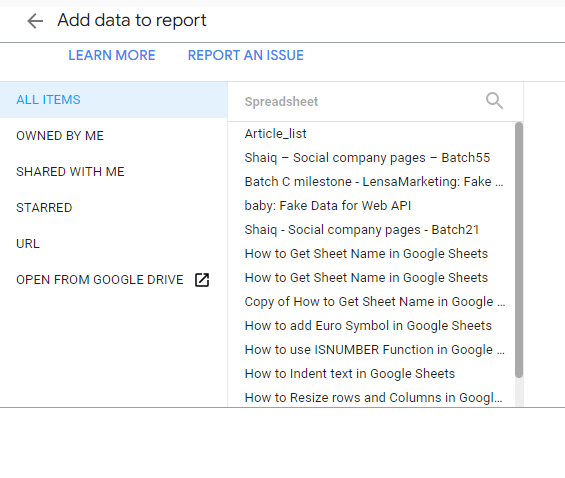
Clicking on any of the data sources will open all the files you have stored for the specific platform (Like Google sheets)
Tip: These all are data connectors, most of them are free and some of them are third-party connectors that are paid with some day’s free trial.
Step 5
You can search your required data source name here in the search bar
Step 6
Click on the connector to connect with it
Step 7
On the next page, you will be asked to select a channel (as we have selected youtube analytics)
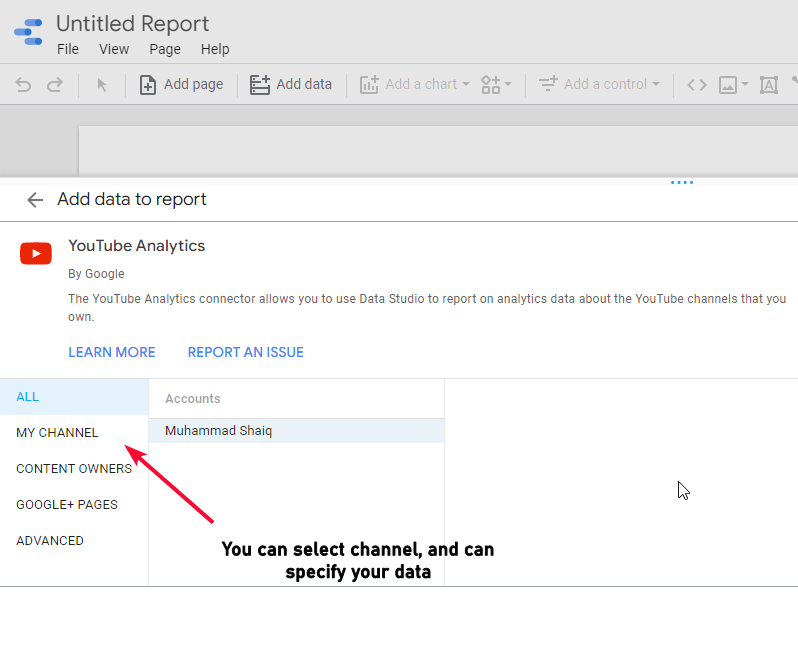
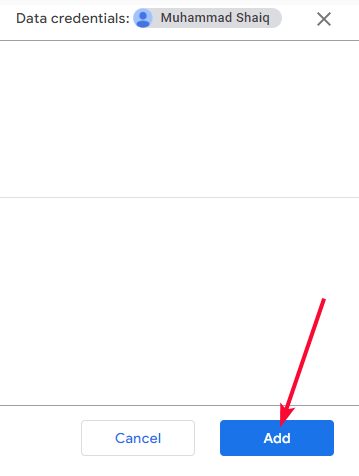
Step 8
On the right-hand side below, you will see an “Add” button, click on it to connect the data source with Google Data Studio
Step 9
On the next page, you have all the data fields of your connected data, here you can edit or customize your data points, and data types, but for now, we will go with the default values
Tip: This page is mostly used when you have your custom data connected with Data Studio, for any built-in source of data like YouTube analytics, this page is normally kept with default settings.
If you don’t see this page, it’s okay. Data Studio only shows this page when needed.
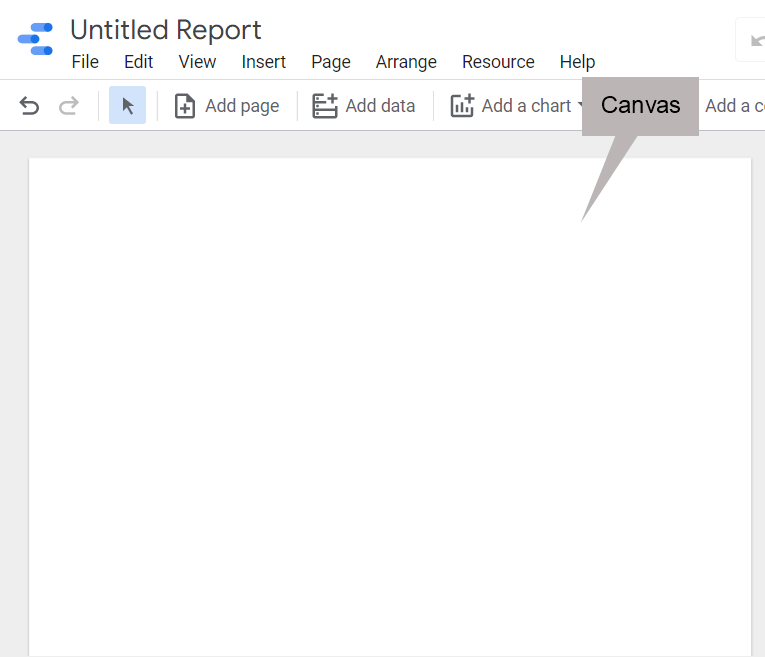
Step 10
Now you have your first blank canvas for creating beautiful reports with your YouTube analytics data.
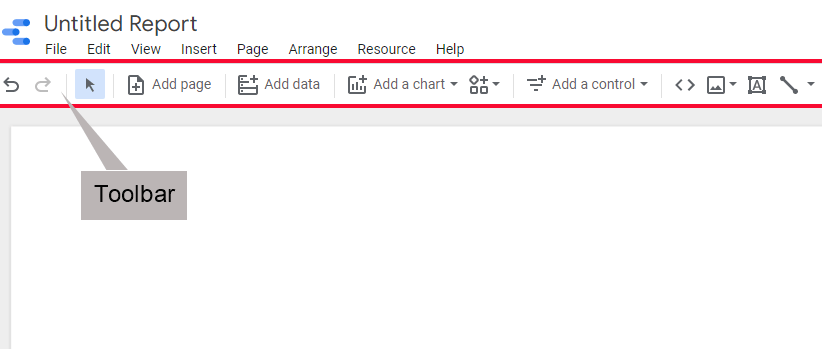
Step 11
On the top, you have a toolbar
Step 12
In the top-most area, you have your main menu
Step 13
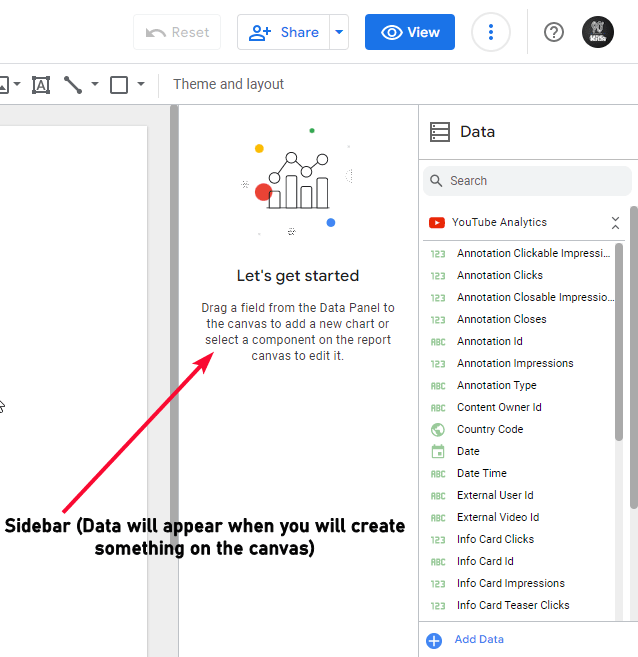
On the right side, you have a sidebar that has all the editing and customization options for a specific component you have selected.
So this is how you get started with Google Data Studio. These are all the things you have to deal with when you are creating a report on Google Data Studio
To create your first report, let’s first understand the options we have in the toolbar and the main menu, to get used to Google Data Studio and to understand where the general purpose and frequently used buttons are located we must understand the fundamentals of the Data Studio Toolbar.
Getting Started with Google Data Studio – Explore Data Studio Toolbar
Here, we have so many options and direct buttons to perform tasks, let’s see them step-by-step and explore the functionality and the usage of each of these buttons and controls.
Step 1
Firstly, on the left-most side of the toolbar, we have Select, undo and redo self-explanatory buttons, we have these buttons in every tool and we can Select any area on the canvas using the Select button like photoshop, and undo and redo are used everywhere with keyboard shortcuts ctrl + z and ctrl + y respectively
Step 2
Then, we have the ”Add page” button, here we can add pages, some reports can be on one page, but some big reports may require multiple pages, so we can add/remove pages from this button and it will be like a scrollable file just like we have in Google Docs.
Step 3
Then, we have the “Add data” button which is used to add more data sources as we have done above.
Step 4
Now you have the most important component. Add a Chart drop-down has so many types of charts categorized with the type name like Table, Pie, Bar, Scorecard, Line, Geo, and many more.
Step 5
Next, you have the “Add a Control” dropdown in which we have various options to add different controls in our canvas to support our report
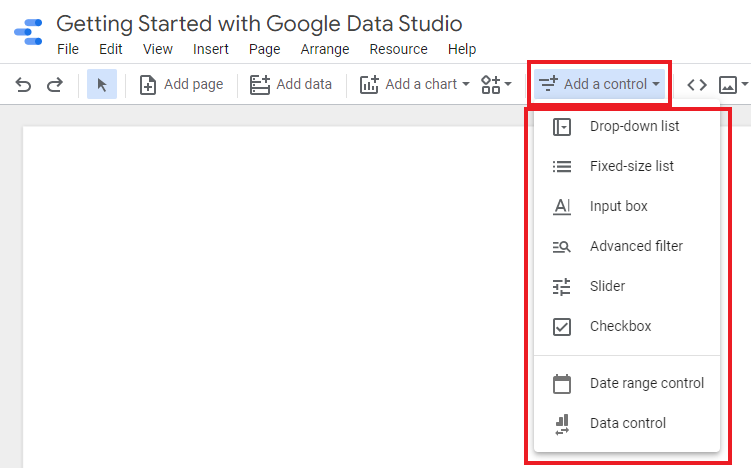
Step 6
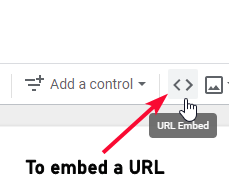
Here we can add a working link to redirect a viewer to a specific web address.
Step 7
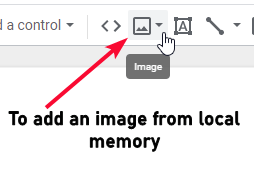
Here we can add a static image, its most probably a logo, a brand image, or can be a banner image of any size.
Step 8
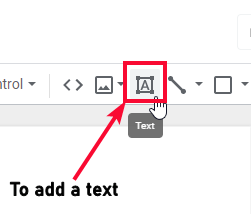
A text option that helps us add text with basic text formatting options
Step 9
Then we have a line tool, we can draw lines of different types on our canvas using this tool
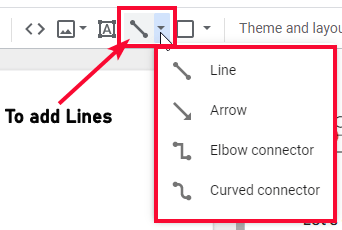
Step 10
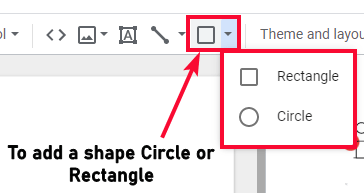
Now, we have a shape tool that is primarily used to design a shape of a circle and rectangle to have the report inside that shape
So, this was the simple and easy Toolbar of Google Data Studio, I hope you have got a basic understanding of it, so next time when we create real reports you will not be confused about these basics. Knowing that this is a very basic tutorial of our Google Studio Series, I will end it up here.
I hope you find this tutorial helpful.
Important Notes
- This is the introductory article for Google Data Studio, we will see all the options and tools in detail in the coming tutorials.
- Google Data Studio is free just like sheets, I will recommend you to use only free data connectors
- Working with Data Studio is not as simple as you saw in this article, but also not as difficult as you may think when you first time land on the Google Data Studio blank canvas, I will teach you each and everything about it sooner in this series.
Frequently Asked Questions
Why do we need Google Data Studio?
Google Data Studio is a free report generation tool by Google, we use it mostly to create beautiful and interactive charts, reports, tables, scorecards, graphs, pies, and so on. This is a free tool and it’s very powerful when and useful when you compare it with the competitors. It’s free and can be started only with a Google Account. There are so many functions, formulas, and regular expressions, used in Google Data Studio to make it more efficient and to make more customized and branded reports for your clients. Try it out now https://datastudio.google.com/
Is Google Data Studio Free?
Yes, Google Data Studio is a free tool just like Google docs and Sheets. You only need a Google account to start working with Google Data Studio to create personalized and branded reports.
Can I create a report using custom data inside a Google Sheets file?
Absolutely yes, you can have your data source in any format, you can directly connect a platform report from the cloud, or you can even connect your Google sheets file with custom data in it to make beautiful reports.
Conclusion
Wrapping up the Introduction to Google Data Studio, we have seen what is Google Data Studio and how to get started with this excellent and powerful application with any source data to start reporting and creating attractive and branded reports. This is the first article of our Google Data Studio series, to keep learning it for free you can Subscribe to use and get the notification on every newly published tutorial. I will see you soon. Thank you Keep learning with Office Demy.


