
To Use Linest Function in Google Sheets
For Simple Liner Regression:
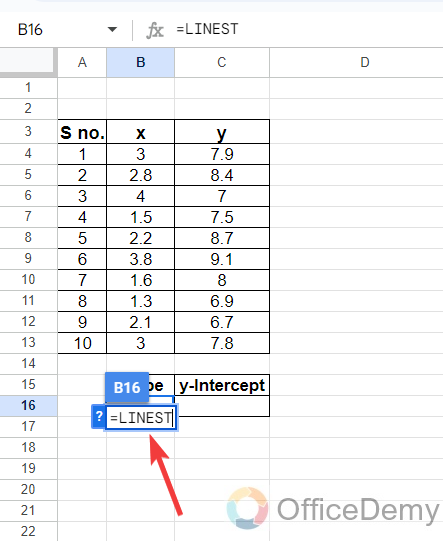
- Start the Linest Function.
- Pass the range for the values of y
- Pass the cell range for the values of x
- Write the default value of y-Intercept by writing “TRUE“
- Write “FALSE” to find simple linear regression in verbose.
For Multiple Liner regression:
- Start the Linest Function.
- Pass the Range for the values of y
- Pass the cell range for the values of x
- Write the default value of y-Intercept by writing “TRUE“.
- Write “TRUE” to find multiple linear regression in verbose.
The Linest function of Google Sheets is a very useful function used for the analysis of data and statistics. Usually, the Linest function is used to perform Linear regression in Google Sheets. The usage of the Linest function is a little complicated but if you understand the logic then you may easily apply the Linest function in every scenario.
Below is the complete guide on how to use Linest function in Google Sheets.
Advantages of Using Linest Function in Google Sheets
The linest function in Google Sheets is used to perform the linear regression analysis which helps to analyze data and make predictions. This function helps you to find the best-fitting straight line through a set of data points and the relation between two variables. You can also use the Linest function for forecasting.
Syntax
=LINEST(known_data_y, [known_data_x], [calculate_b], [verbose])
- known_data_y – It refers to the array or range containing dependent values already known.
- known_data_x – It refers to the values of independent variables that correspond with known_data_y
- [calculate_b] – It is an optional argument that calculates the y-intercept (b). If FALSE, the function forces b to be 0, which forces the line to pass through the origin.
- [verbose ]– It is also an optional argument that specifies whether to return more regression properties. By default, it is set to FALSE which refers to simple linear regression.
How to Use Linest Function in Google Sheets
The Linest function is used to find Linear regression in Google Sheets. There are two different types of Linear Regression in Google Sheets, Simple Linear regression and Multiple Linear Regression. In this tutorial, we will learn both of them by using the Linest function in Google Sheets.
- Simple Linear Regression by Linest Function
- Multiple Linear Regression by Linest Function
Simple Linear Regression by Linest Function
If you want to perform simple linear regression in Google Sheets then follow the following method.
Step 1
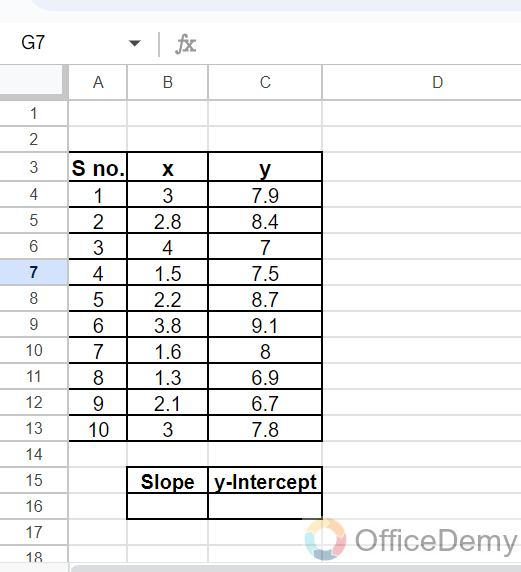
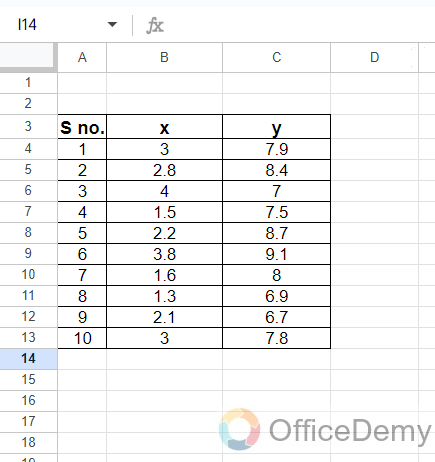
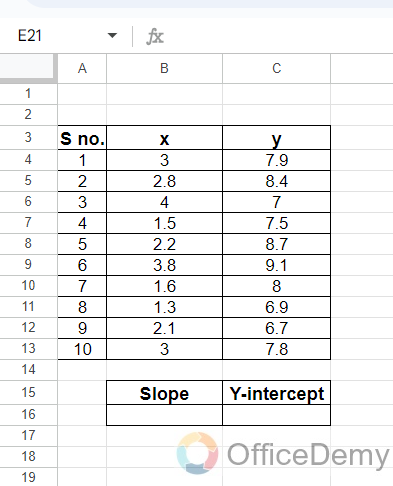
In Google Sheets to use a Linest function, first, we have required different values of two different variables like x and y. So we have taken a table containing different values of x and y in the following example.
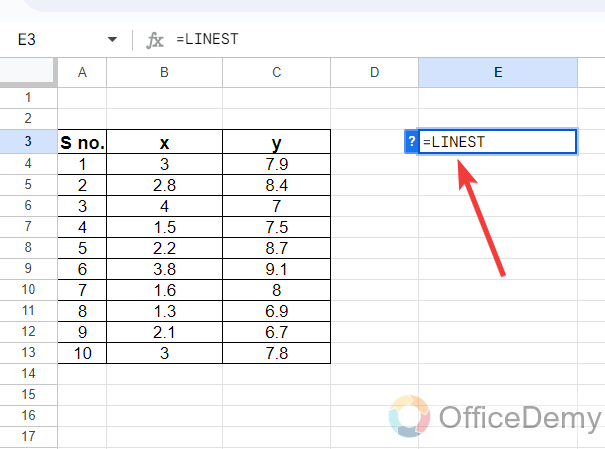
Step 2
When we perform simple linear regression in Google Sheets, we get two different answers: slope and y-intercept. So first place your cursor where you may get these both answers.
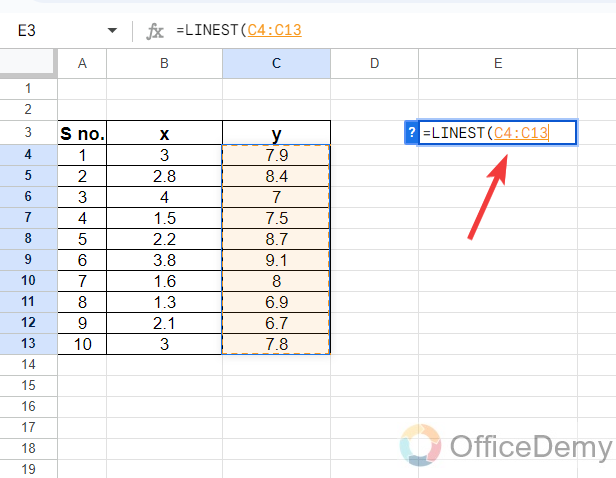
Step 3
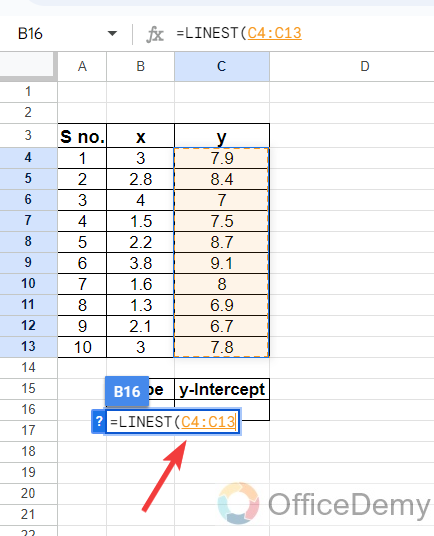
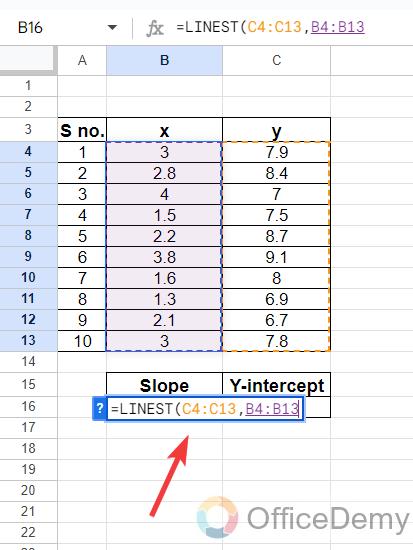
According to the syntax first we have to insert the values of y so here we have taken the C4:C13 cell range for the value of y from the following example.
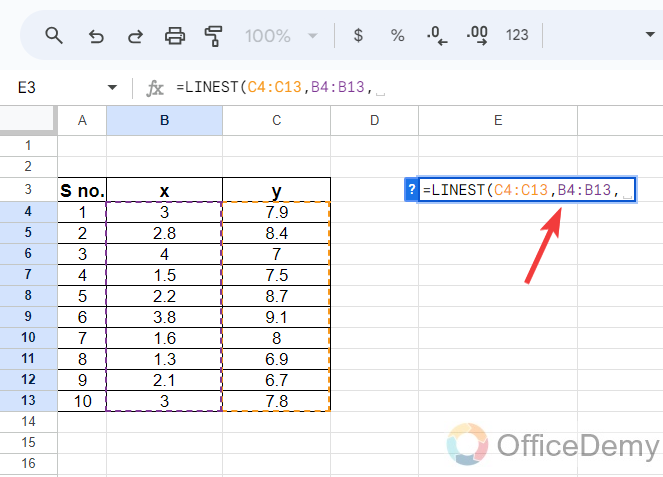
Step 4
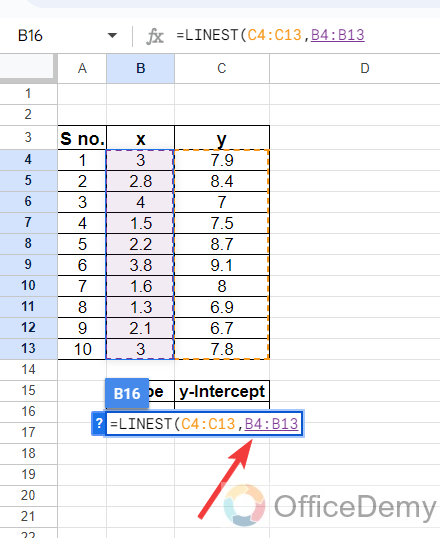
Similarly, after the value of y, we have to give the cell range for the values of x so, we have inserted the B4:B13 cell range in the syntax for the x according to the following example.
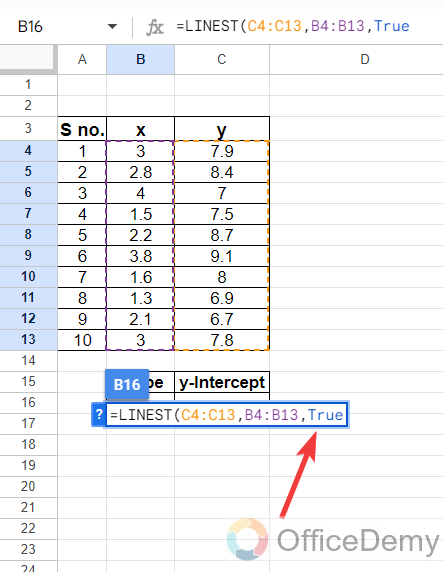
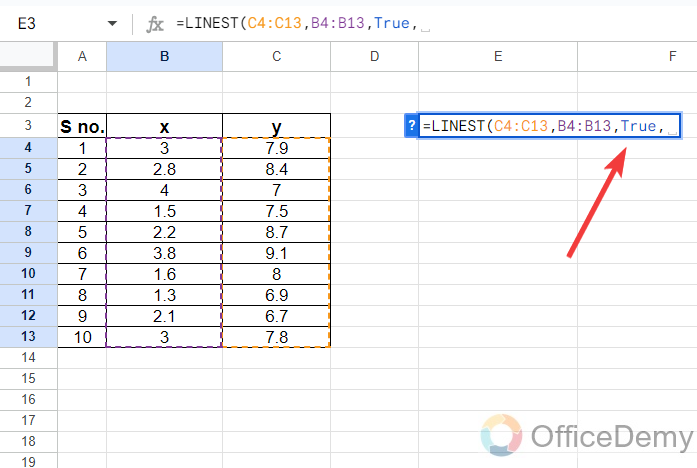
Step 5
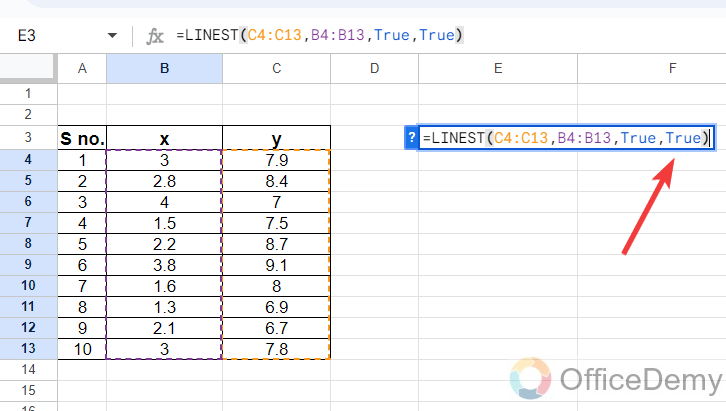
Once you have given the values of x and y then the third parameter of the syntax is the b value or the y-intercept which by default remains “True” so I have written “True” in the following example.
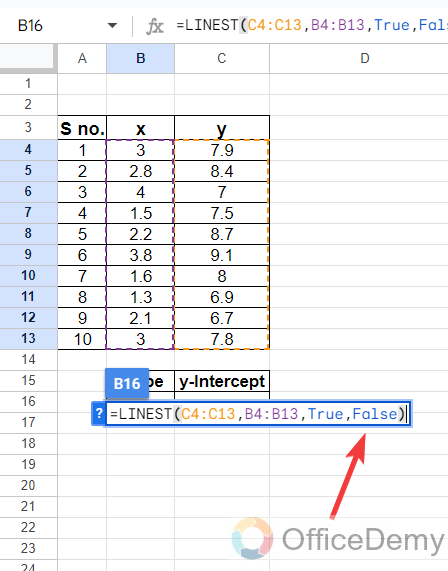
Step 6
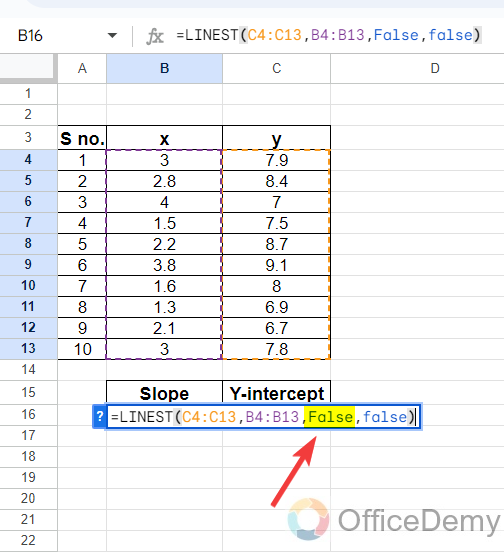
After giving the value of b in the syntax, the fourth parameter of the syntax is verbose. By default the verbose remains “False” when we perform a simple linear regression in Google Sheets. So here I have written “False” in the following example.
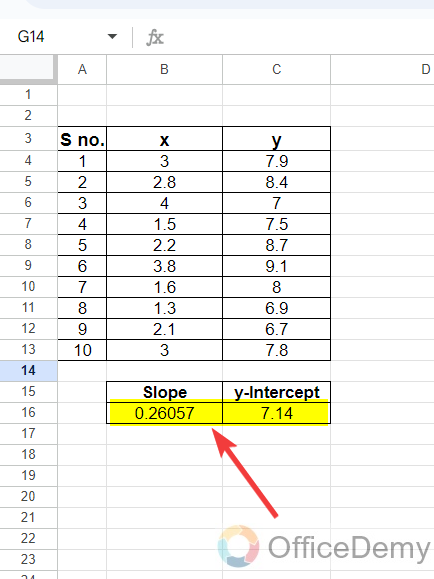
Step 7
As we have completed the syntax for simple linear regression close the bracket and hit the Enter key, You will get your result in the form of slope and y-intercept as highlighted in the following picture.
Multiple Linear Regression by Linest Function
If you want to perform multiple linear regression in Google Sheets then follow the following method.
Step 1
To find multiple linear regression in Google Sheets with the help of the linest function we have required only the values of two different variables as in simple linear regression.
Step 2
To apply multiple linear regression or to get more properties of the linest function, first place your cursor in such a position where you are able to get multiple results. Start running the Linest function by writing “Linest” with an equal sign.
Step 3
After starting the linest function, we will provide the cell range of the values of the y variable as highlighted in the following picture.
Step 4
Once you have written the cell range for the values of y then similarly we will write the cell range for the values of x. To separate these ranges put a comma between them as I have written in the following picture.
Step 5
According to the syntax, after writing the cell ranges of both values, we use “True” as a third parameter for the value of the b or y-intercept.
Step 6
In Google Sheets, while applying linear regression, the fourth parameter in the syntax tells that it is simple or multiple as by default it remains false for simple linear regression but here we are performing multiple linear regression so we will use “True” for the fourth parameter in the syntax.
Step 7
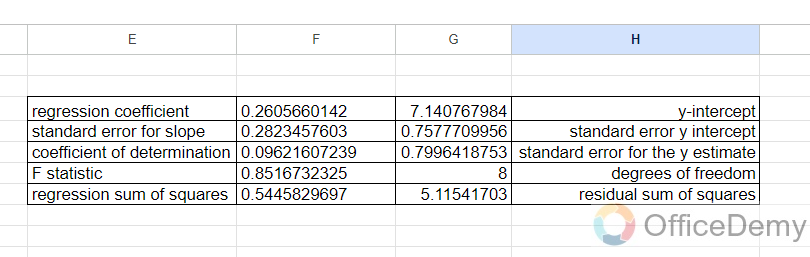
We are almost done with writing the syntax to apply multiple regression in Google Sheets just press the Enter key and get your all properties in front of you as displayed in the following screenshot.
Frequently Asked Questions
Can I Define Variables in Google Sheets When Using the Linest Function?
Yes, you can define variables in Google Sheets when using the Linest function by using the custom scripting feature. This allows you to assign values to variables and use them in the Linest function to perform calculations and generate results. Using variables in google sheets adds flexibility and ease in modifying and manipulating data.
Can the Linest function in Google Sheets be used to calculate uncertainty?
Analyzing uncertain data in google sheets can be simplified using the Linest function. This powerful tool allows users to calculate uncertainty in their datasets efficiently. With Linest, you can obtain valuable insights and make informed decisions based on the certainty of your data.
What are the Differences Between the OFFSET Function and Linest Function in Google Sheets?
The differences between the OFFSET function and LINEST function in Google Sheets are significant, especially when it comes to their purposes. The using offset function in google sheets allows you to dynamically reference a range based on specific conditions, while the LINEST function is primarily used for calculating regression analysis and obtaining statistical information.
How to put a y-intercept equal to zero in the linest function?
A: In the linest function the value b or y-Intercept is set to True by default but you can put it to zero by writing the “False“.
Step 1
If you want to put a y-intercept equal to zero while applying linear regression in Google Sheets. Let me tell you with the help of examples, first, take sample data containing two different variables as follows.
Step 2
To apply linear regression first we will take a linest function and insert the cell range of the values of both variables, First, we will take the cell range of y and then x according to the syntax.
Step 3
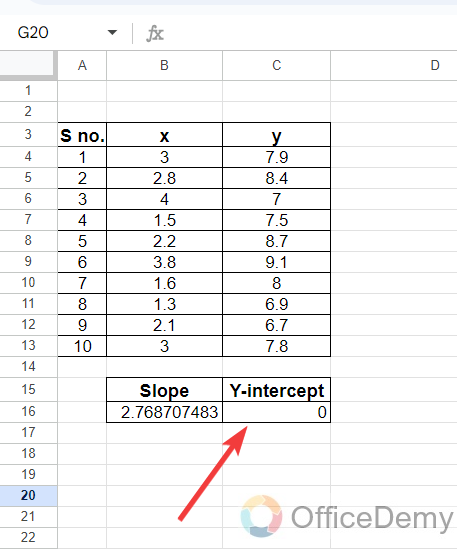
As we all know the third parameter in the formula of linest function represents the values of y-Intercept which is by default “True” when it is not equal to zero but if you want to put b = 0 then use the parameter “False” as highlighted in the following picture.
Step 4
As you can see the result in the following picture, as we put the value of b = 0, we have found the y-intercept equal to zero as can be seen in the following picture.
How to find linear regression equations in Google Sheets?
A: As you can perform linear regression in Google Sheets, you can also find linear regression equations in Google Sheets with the following steps.
Step 1
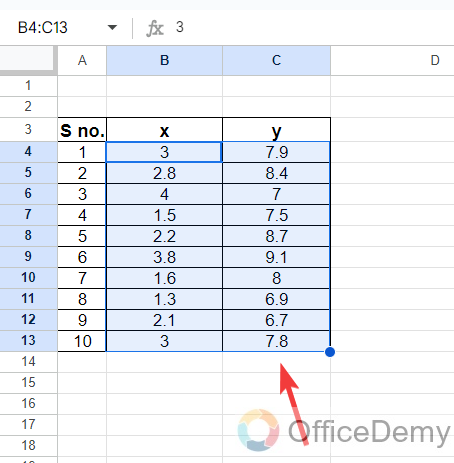
To find a linear regression in Google Sheets, first, you must have sample data containing different values of two different variables x and y. Select all these as I have selected in the following picture.
Step 2
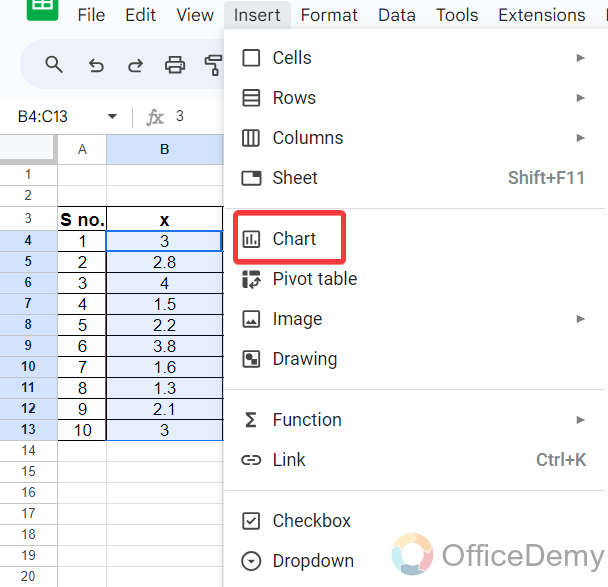
After selecting the data, go into the “Insert” tab of the menu bar in Google Sheets, a drop-down will open where you will see a “Chart” option. Click on it to insert a chat in Google Sheets.
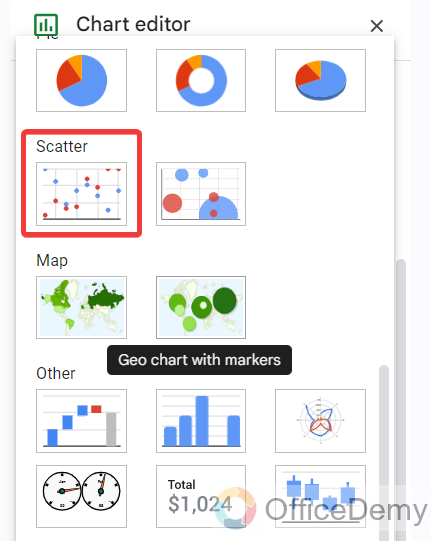
Step 3
Once your chart has been inserted, go into the chart editor and change the chart type to the “Scatter” chart as highlighted in the following picture.
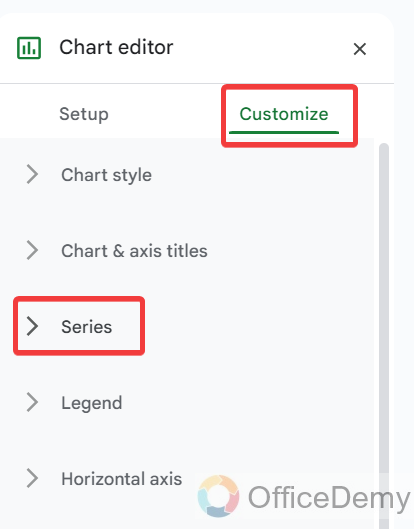
Step 4
After selecting the chart type, go into the “Customize” tab in the chart editor then click on the “Series” option from the list.
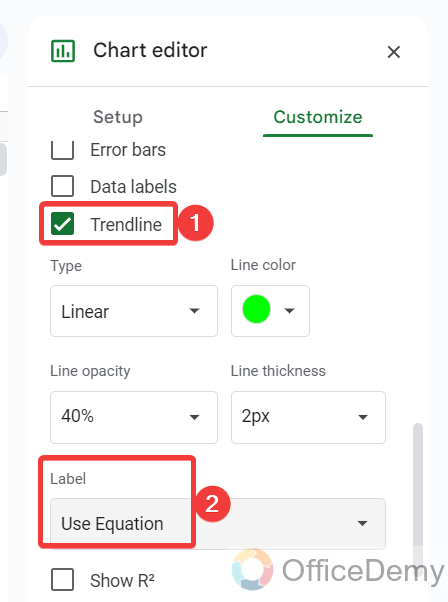
Step 5
When you open “Series” options, on scrolling down you will find an uncheck “Trendline” option. Check mark this option to insert a trendline in your chart then set the “Label” option to the “Use equation” as directed below.
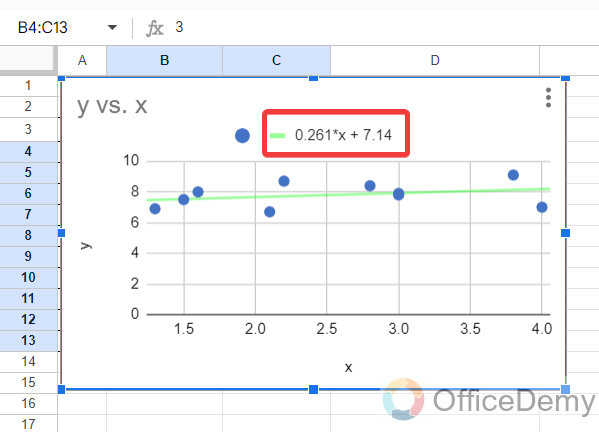
Step 6
Come back to your chart, you will find your linear regression equation in front of you in the chart as highlighted in the following picture.
Conclusion
Hope you understand now, how to use Linest function in Google Sheets. For more related topics keep visiting our site OfficeDemy.


