
To Calculate Average:
- You can calculate the average of a range of values using the =AVERAGE(range) formula.
- You can also calculate the average while excluding zero values using the =AVERAGEIF(range, “<>0”) formula.
- To exclude hidden rows from the average calculation, you can use the =SUBTOTAL(101, range) formula.
To Calculate Median:
- The median is the central value in a set of data > You can calculate it using the =MEDIAN(range) formula.
To Calculate Mode:
- Use the =MODE(range) formula.
- Note that the MODE function may return an error if there is no mode (no value occurs more than once) or if there are multiple modes with the same frequency.
To Calculate Standard Deviation:
- Use the =STDEV(range) formula.
- A low standard deviation indicates that data points are close to the mean, while a high standard deviation suggests greater variability.
In this article, we will learn how to calculate the Average mean and standard deviation in google sheets. We will learn how to use statistics metrics in Google Sheets, in statistics we have many formulas and metrics to solve complex math’s, probability, and statistics problems. The most common and basic concepts that may come to your mind are the average, mean, and standard deviation. Today, we will learn these and many more. So now you can excite because we are entering the statistics formulas in the google sheets tutorial series.
Average, mean and standard deviation
We all have studied statistics and probability as math subjects, or maybe we have studied them as separate subjects. Most of us had to study it whether we like it or not but being an adult you must have some excitement about it? if not, I am here to bring the excitement, we all are curious when learning math, especially the probability and statistics because they deal with real-world data and bring real-world examples, now in today’s world we have software products like google sheets that are trained to understand math formulas and help us using those formulas in our real-world data that is managed on google sheets. So, we need to learn how to calculate the average mean and standard deviation in google sheets.
How to Calculate Average, Mean, Mode and Standard Deviation in Google Sheets
As we have already discussed the topic in the introductory sections above, I would love to take you guys towards implementing these formulas. So, as our usual practice we will break this article down into many sections, and in each section, we will see a different part of this topic. We will see examples and step-by-step implementation to solve a particular problem.
In the first section, we will see how to calculate the average in google sheets, from the main topic how to calculate the average mean and standard deviation in google sheets.
How to calculate Average in google sheets
Let’s first understand, what is average? Average is the mid-value of a series of data. In other words, It is calculated by adding all the numbers together and then dividing the sum by the total numbers. It’s called Average. Let’s say I have a series of data (1,2,3,4,5) what will be the average? a traditional method to calculate the average of a given range is adding all the numbers 1+2+3+4+5, they are 15 now divide the sum (15) with the total numbers (5), so the formula will be 15/5 and the result will be 3. This is how a basic average function works. But in google sheets, we have a direct formula =Average(range) that automatically calculates the average. We will see how to use it.
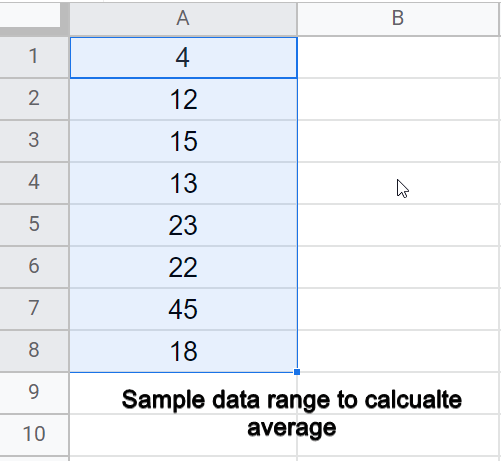
Step 1
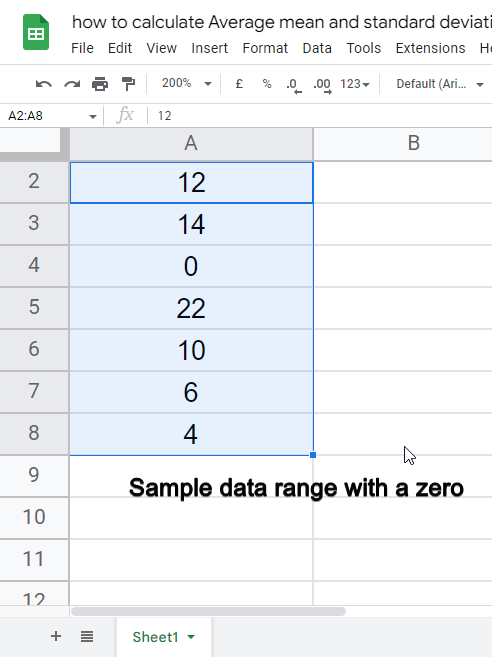
Bring a sample data range.
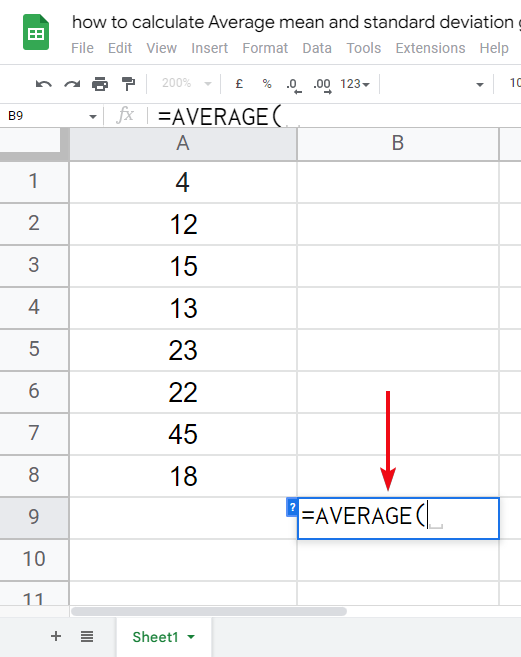
Step 2
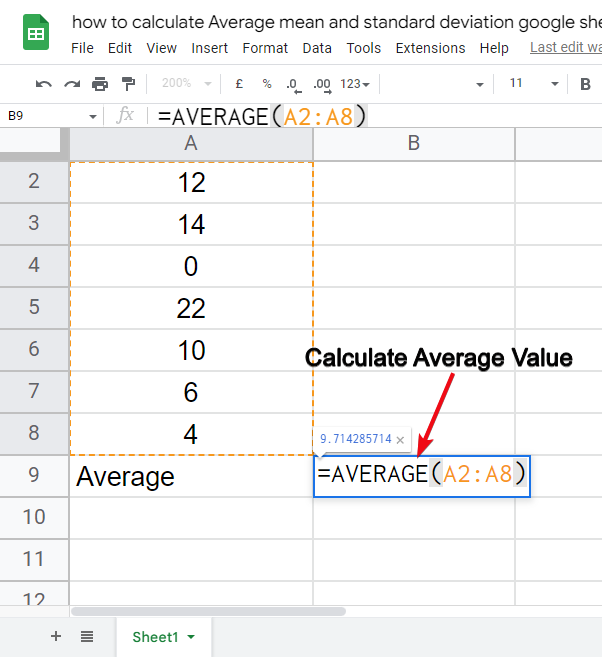
Write the =average formula in any other cell.
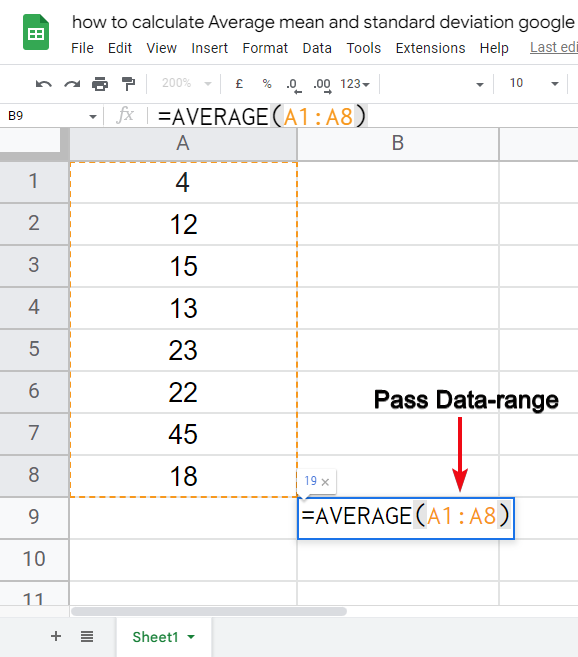
Step 3
Pass your range in the formula
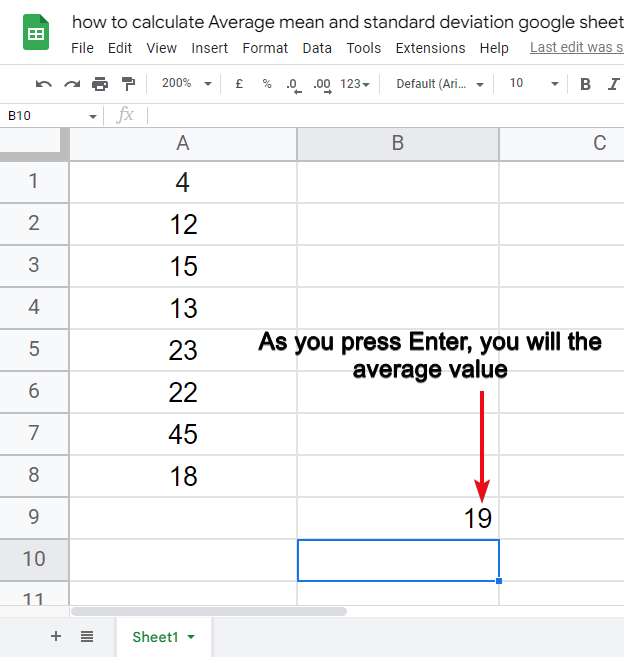
Step 4
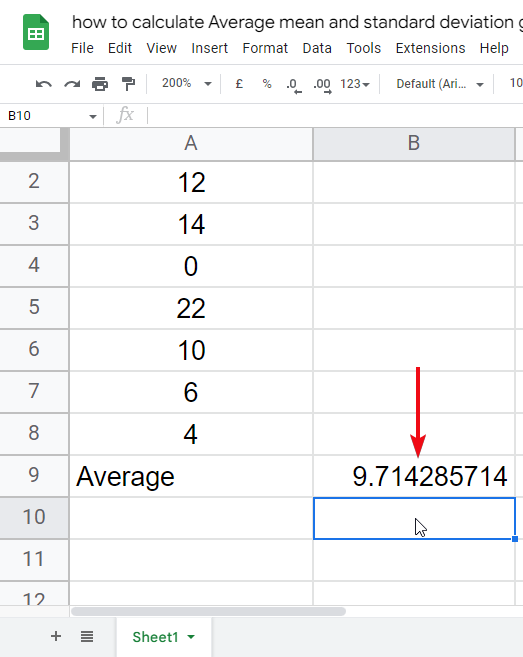
Hit Enter, and you’ve got the average value
But what if your data have some zero values, and you don’t want to include zeros in the formula. There is a trick for you.
How to calculate Average neglecting zeroes in google sheets
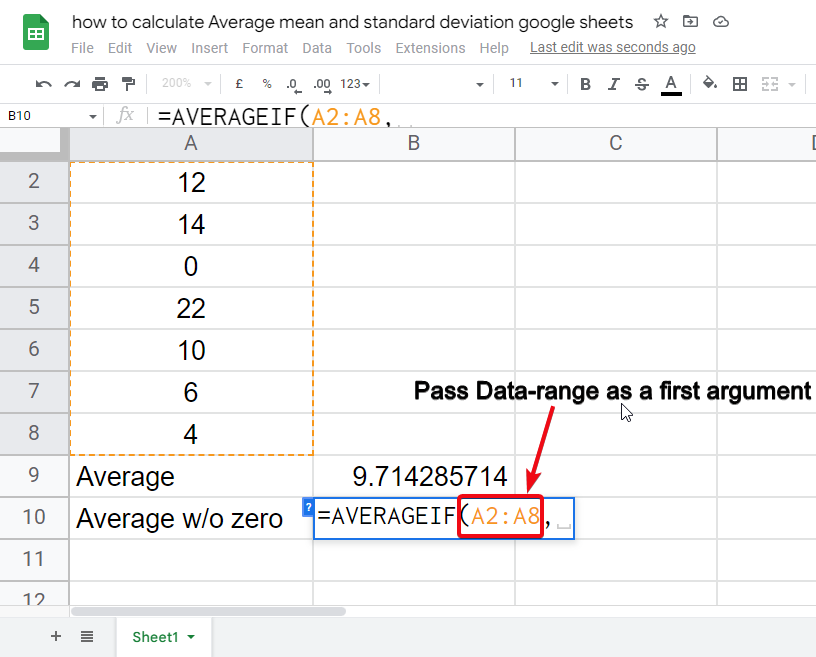
Sometimes we don’t want to include zeros, because zeroes can highly impact the average value, there are two types of average calculated, one is with zeroes, and the other is without zeroes, so we will now see how to calculate an average without zeroes. For this we have a variation of =Average formula which is =AverageIF(). We will use =AverageIF() and pass the condition to neglect the zeroes in the given range.
In this example, I will use a data range for which I will calculate the average with zeroes and without zeroes in two adjacent cells.
Step 1
Take a data range with at least 1 zero in it.
Step 2
Select a cell, and calculate the average for this range.
Step 3
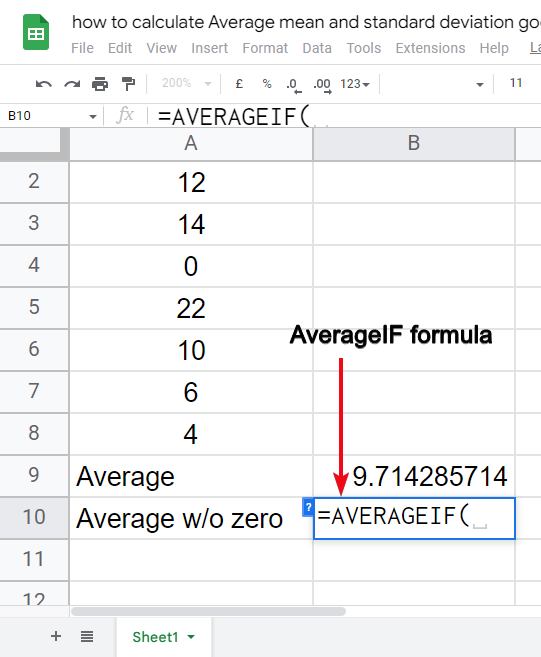
Select another cell and write the =AverageIF() formula.
Step 4
Pass the arguments in =AverageIF formula
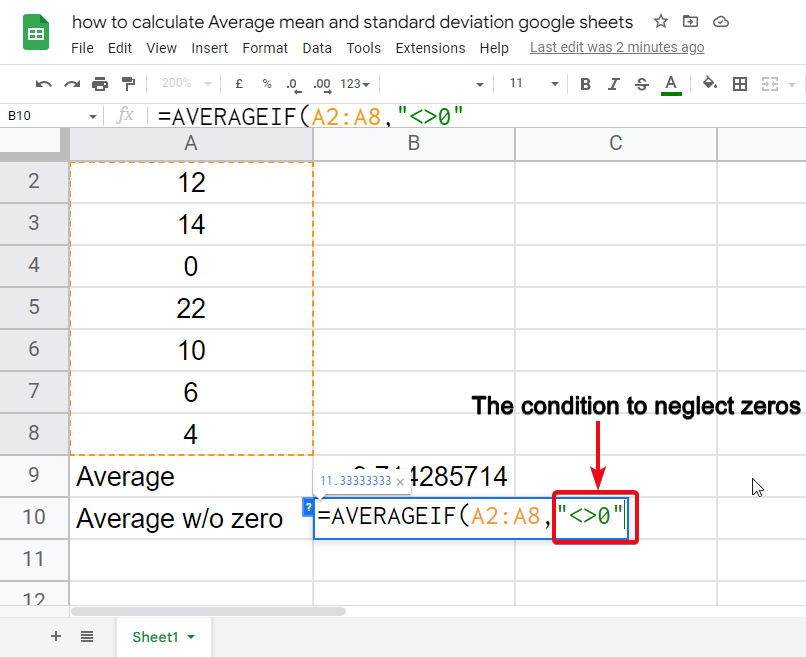
Step 5
Pass the if condition for =AverageIF formula
Step 6
Hit Enter, and see the difference between both average values.
Formula used in this section
=averageif(B2:B4,”<>0″)
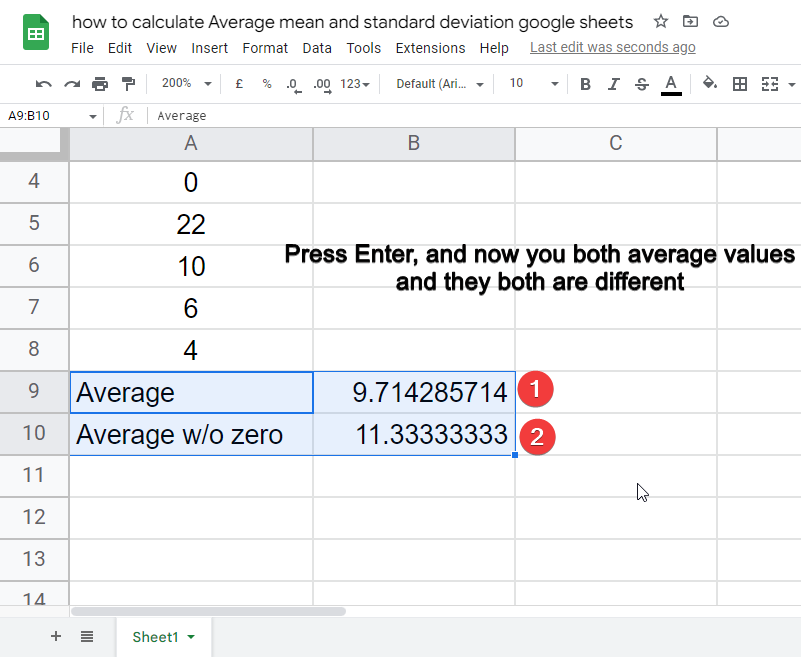
You have seen how can we find two different average values with zeroes and without zeroes.
Still, I think there are some doubts, let me explain, many times we have some hidden data for some rare cases, but when we calculate the average, the hidden values are included automatically, so how can we avoid or neglect the hidden values in our average formula. In the below section we will see the same problem.
How to calculate Average neglecting hidden rows in google sheet
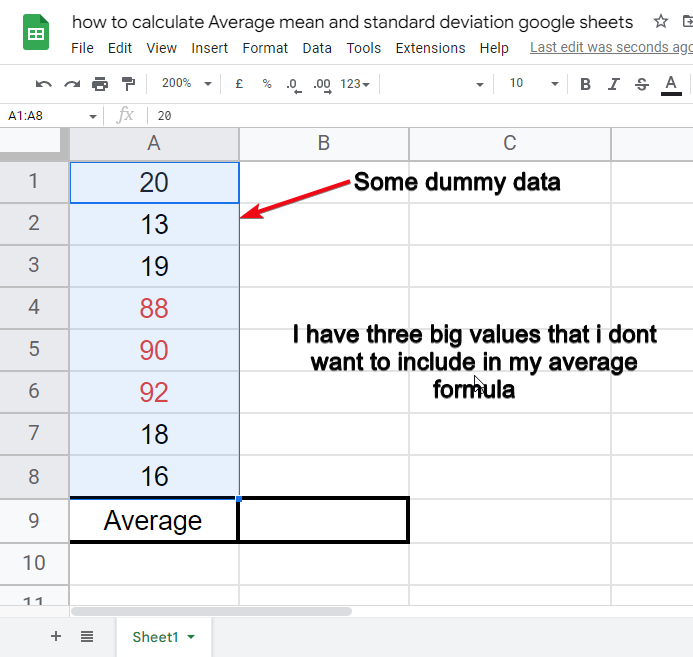
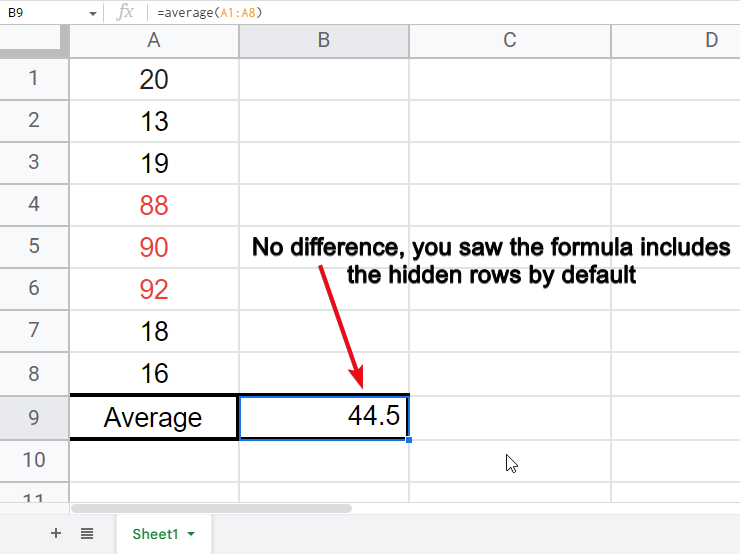
This section will cover, how to calculate the average neglecting hidden rows in google sheets, if you try to calculate the average of a range that has some hidden rows with some values, by default you will find the average that will include the hidden values as well, but you don’t want them to be included that’s why you hide them, another use case is that, when you want to calculate an average but there are some excessively high or low values present in your range that you want to neglect, so you hide them and then you calculate the average but nothing change, they will be included by =average formula. So, there is a solution and, in this section, we are going to talk about it.
I have an example of a dummy data range to implement this method. In this data, I have some common and nearing values but one value is highly diverse concerning its value. So, calculating the average with that high value will change my average value very excessively, to avoid that I will hide the value. This is just a use case, there could be many possible reasons to avoid or neglect one or multiple values when calculating the average in google sheets.
Step 1
Bring some dummy data.
Step 2
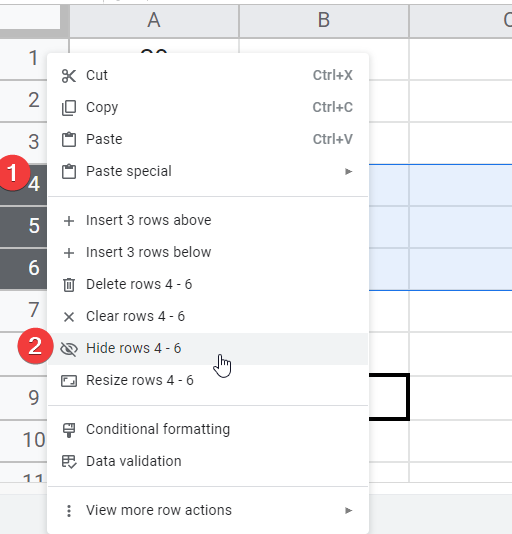
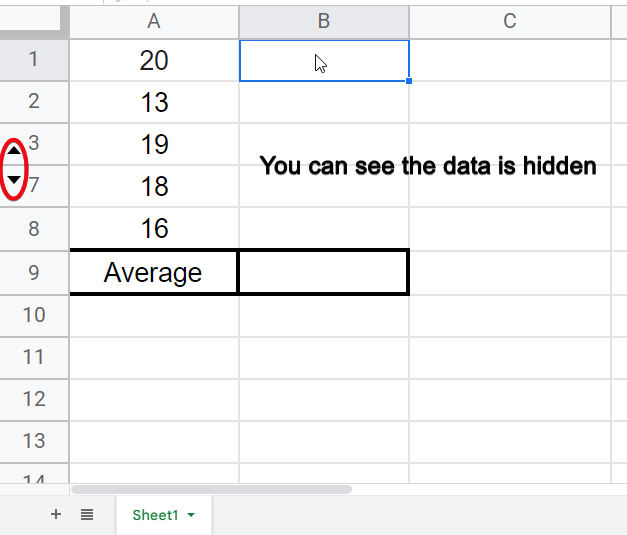
Hide the data (rows), that you don’t want to include in your range
to hide select the rows > right-click > Hide rows
Step 3
Let us try to apply normal average.
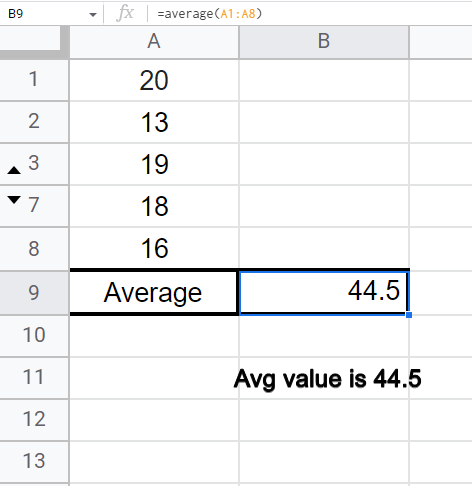
Step 4
Now let us unhide rows and try again with the same formula
Step 5
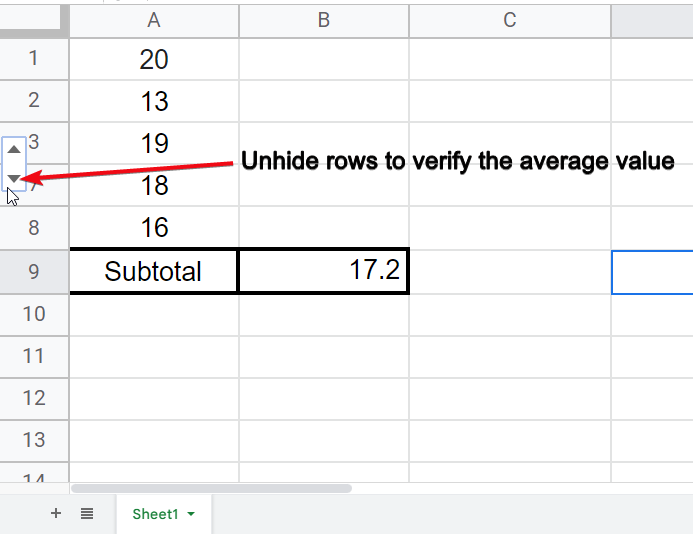
Now, hide rows again, and write =subtotal formula
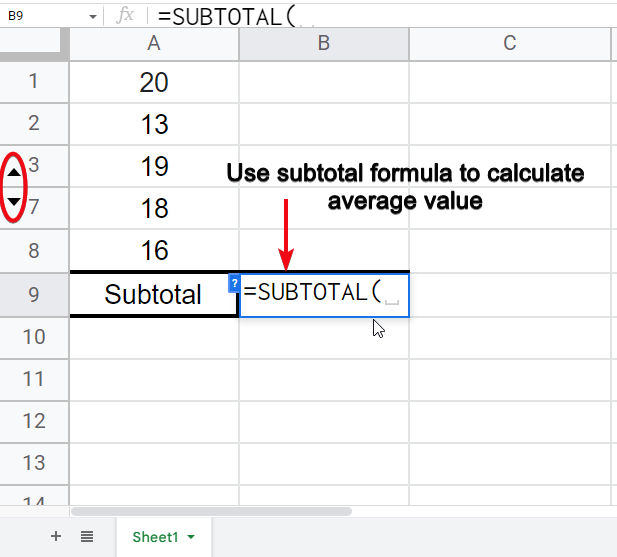
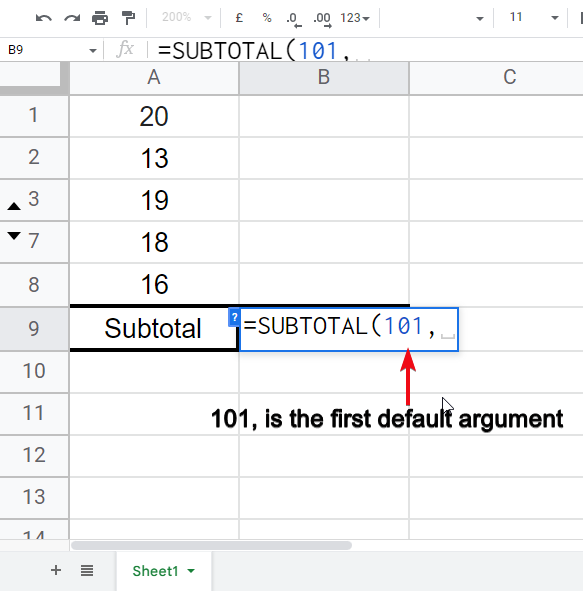
Step 6
Pass the first default argument (101)
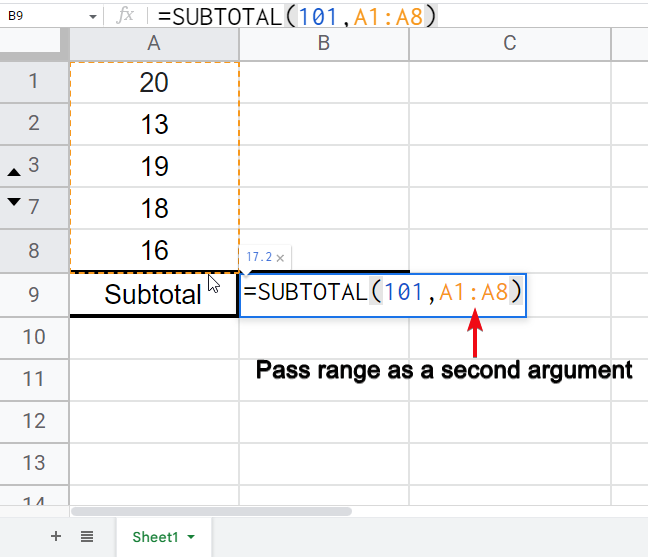
Step 7
Pass the data range (make sure, unwanted data is hidden)
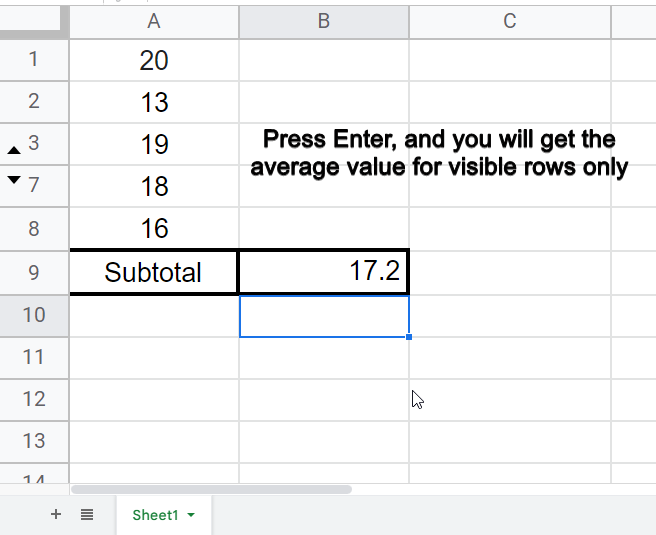
Step 8
Hit Enter, and you’re done.
Step 9
To verify, now unhide the hidden rows, and you will see the average value will change.
The formula used in this section
=SUBTOTAL(101,A1:A8)
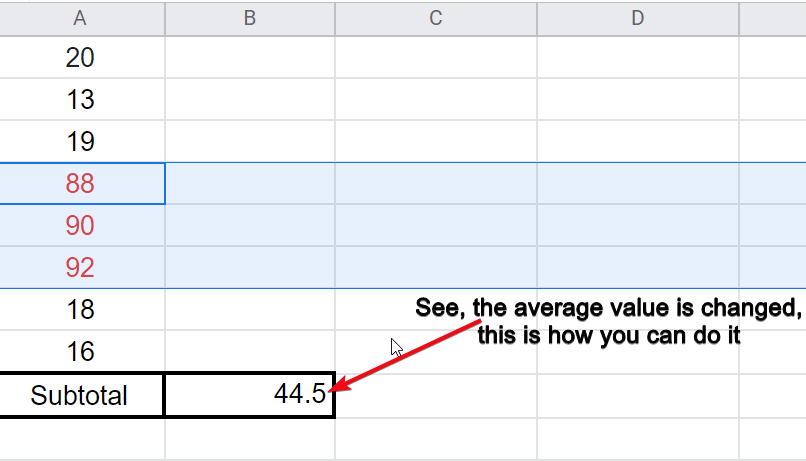
This is how simply you can exclude some of the values by hiding them and using a subtotal formula to calculate the average value.
This was a comprehensive section on average, now we will move to the next section.
How to find/calculate Mean or Median in google sheets
In this section, we will learn how to find Median in google sheets, now this is a very straightforward thing, firstly let us talk about it. What is the Median? Many of us have a misconception that it’s the same as average, but here are some differences.
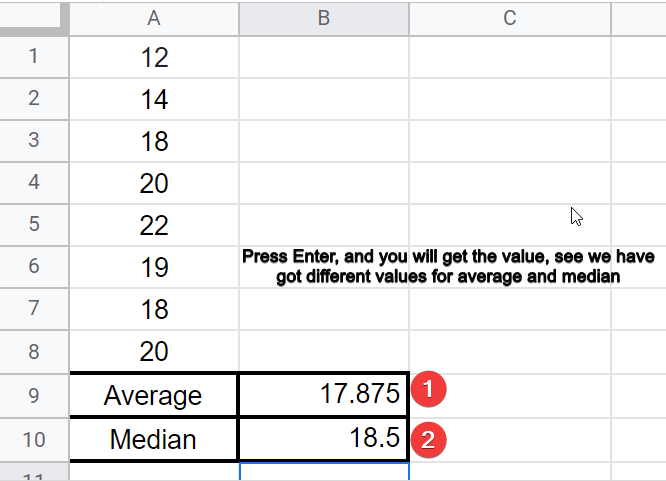
Average is the sum of all the numbers divided by the total numbers
Median is the central value, from where the half observation is smaller and half are larger.
I know it went through your heads. We will see an example below to make you understand how they are different. We will calculate both the average and median for the same series of data to see the differences.
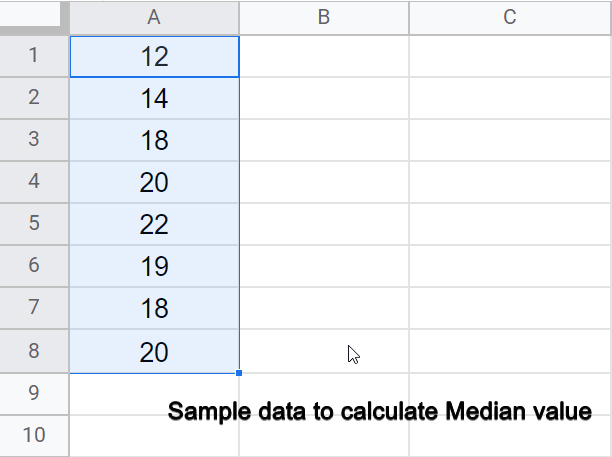
For example, I have a sample data range
Step 1
Make a dummy data range.
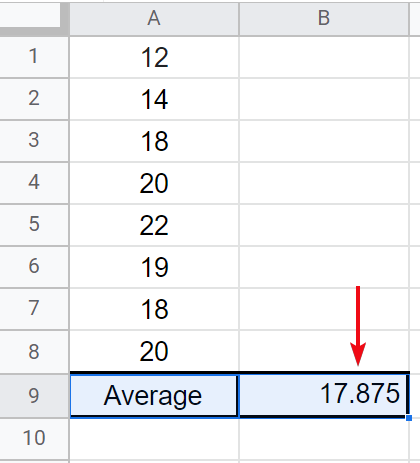
Step 2
Find out average
Step 3
In another cell, write =Median Formula
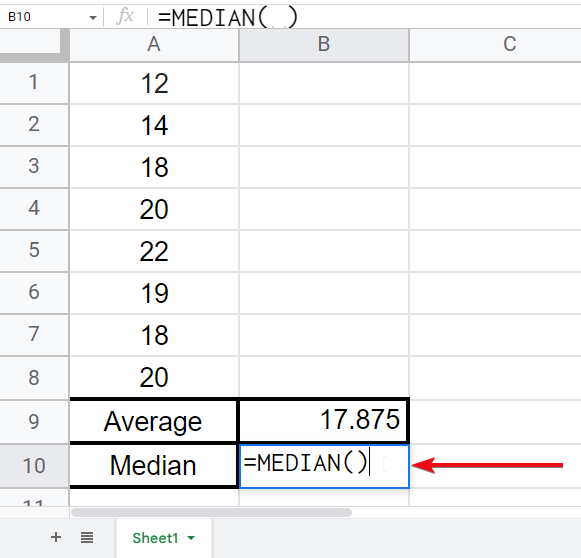
Step 4
Pass the range
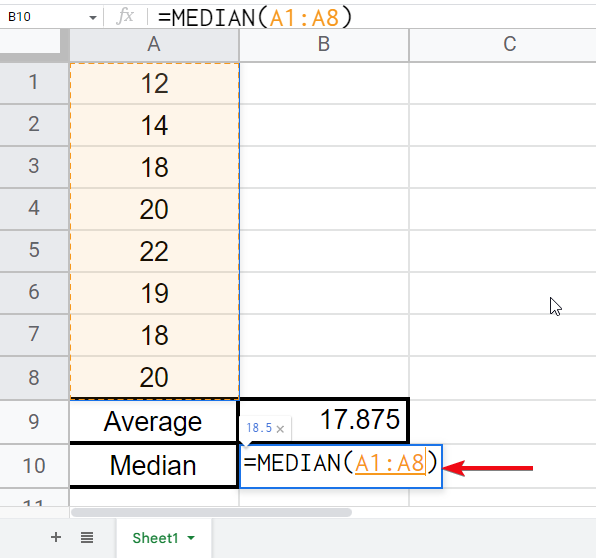
Step 5
Hit enter to find the median value
How to find Mode in google sheets
In this section, we will see how to find the mode in google sheets. Mean Median and mode are taught together in statistics, in google sheets we don’t have any formula for Mean so we are seeing the “Mode” in this section. Let’s talk about it first: Mode is the value that occurs most times in a series of data, yes it’s as simple. We will see it practically in the below example so you will learn why we need it, and how we can use it.
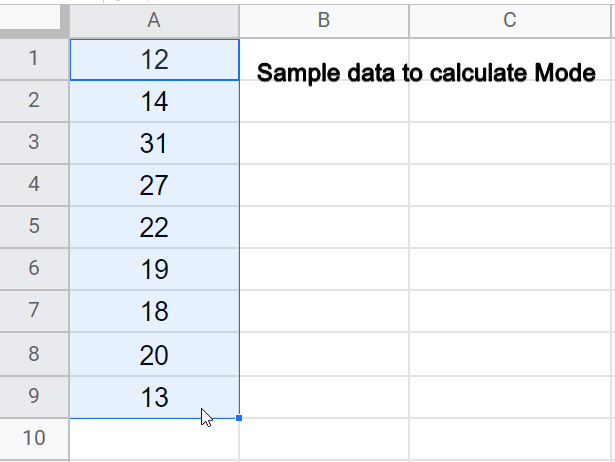
I am taking a simple example to work in this section.
Step 1
Take a sample series of data.
Step 2
In any other cell write the =Mode formula
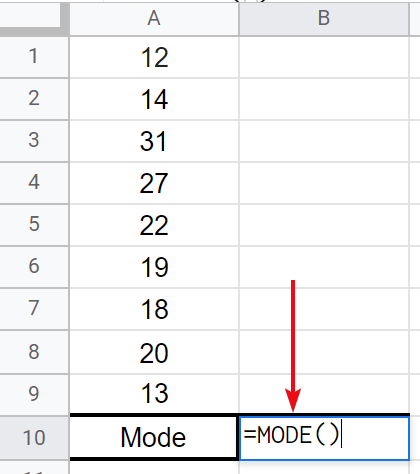
Step 3
Pass the range in the formula
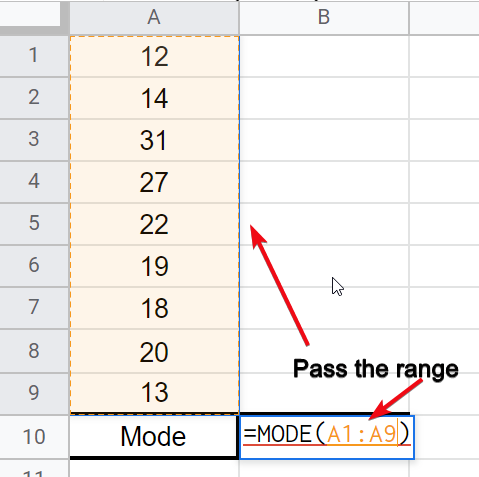
Step 4
Hit Enter.
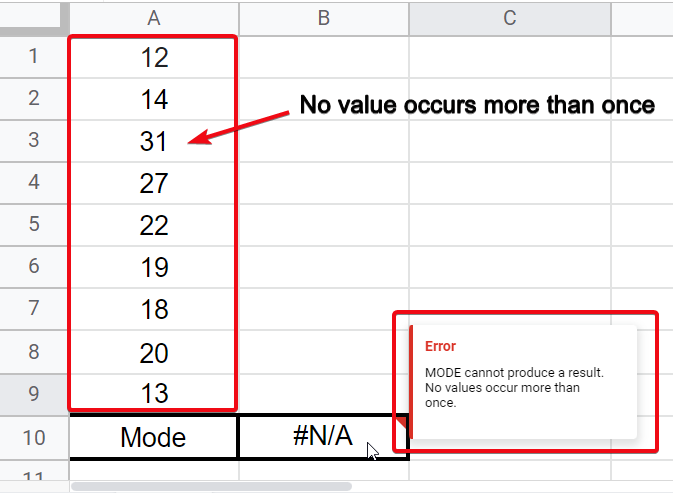
Step 5
(If error)??
Repeat some values.
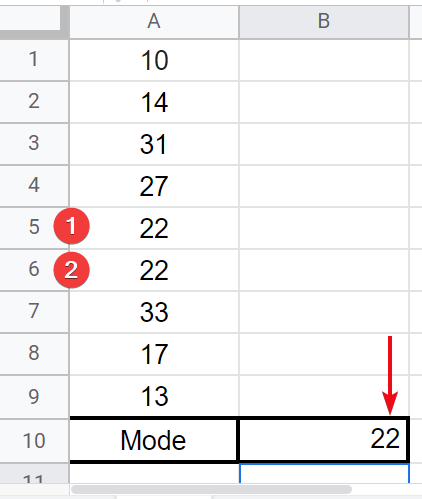
Note: If there are multiple numbers with the same occurrences (twice or more) then the Mode function will prioritize it based on the age of that value, if 3 is added before 2 then 3 will be considered as the mode value keeping in mind that both have the same number of occurrences.
How to find/calculate Standard deviation in google sheets
Finally, in this section, we will see how to find standard deviation in google sheets. First, let us understand what is standard deviation and why do we need it?
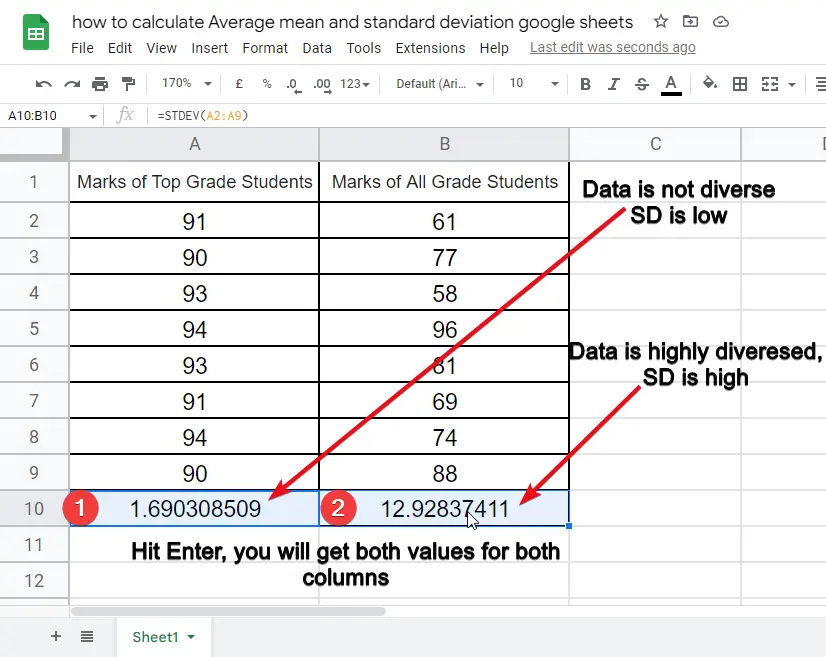
Standard deviation is the measure of the amount of the data dispersion within a data range, it is a metric to find out the diversity amongst the data points. Standard deviation is low when there is less difference among the data points, and it is high when there is a big difference among them.
Let us understand it with the help of an example I have for you.
I will discuss two examples that will clear your mind and you will understand the difference between low and high Standard deviation.
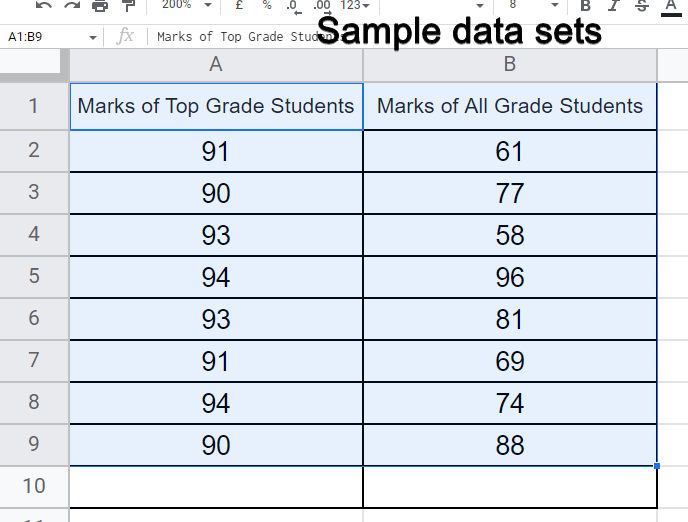
for example, I have data set that has the marks of only top-grade students.
Another data set that has the marks of all grade’s students.
Follow the below step-by-step procedure to implement the example.
Step 1
Make two columns of data as I specified above
Step 2
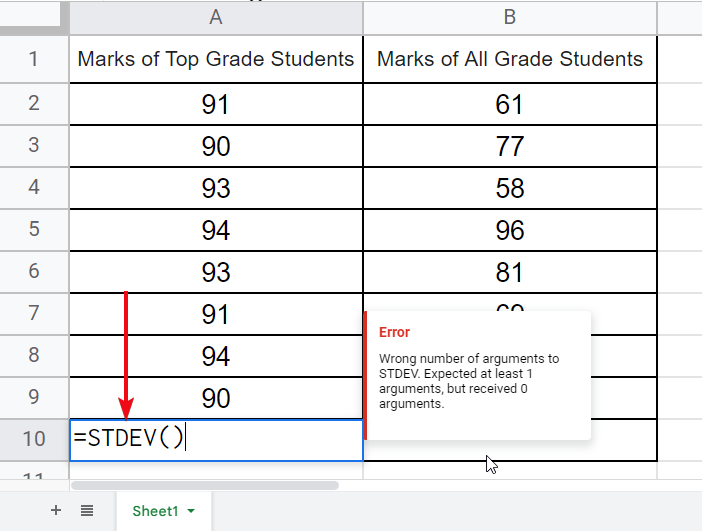
After the last cell of both columns, write the Standard Deviation Formula.
The formula is as below
=STDEV()
Step 3
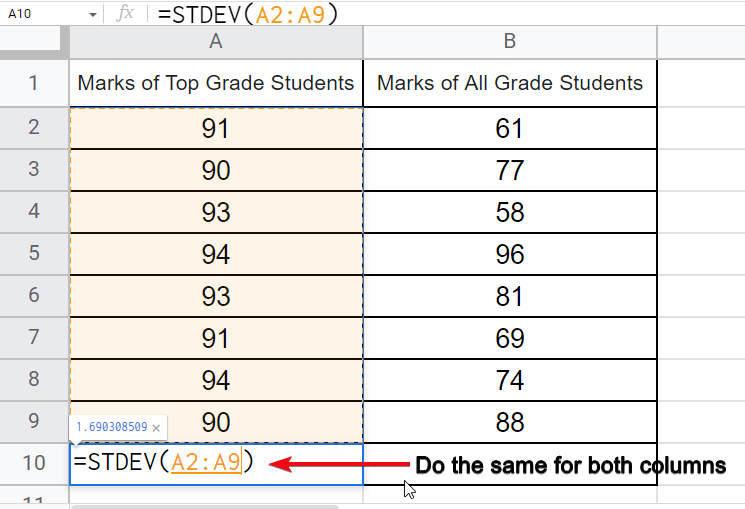
Pass the range of the same column in each formula
Step 4
Hit Enter, and you will get two Standard Deviation values for two data ranges
Conclusion
So today, we learned about some statistical metrics in google sheets, we saw how to calculate average mean and standard deviation in google sheets, we further discussed some related topics like mode and median, also we saw two additional variations of average in the very first section. I hope you guys liked this article and have learned something from it. Subscribe to our blog to keep on exploring and learning google sheets and other related stuff.
