
To Blend Data in Google Data Studio
Manual Method:
- Select and right-click on the chart.
- Select “Blend data“.
- Data Studio will automatically create a blended chart that combines data from the selected charts.
Using Joins:
- Go to “Resource” > “Manage Blends“.
- Click “Add a blend” and select your primary data source.
- Choose “Join another table” and select a secondary data source.
- Configure the type of join you need.
- Specify fields to join > Save.
Let’s talk about blending data sources. In this article, we will learn how to blend data in Google Data Studio. Blend means what it suggests in general. Blending data means mixing data, and combining the data from more than one data source. In Google Data Studio, we need this feature frequently, when we are creating a report that has data from so many sources like social media data, Google ads data, Google analytics data, and maybe our custom google sheets file data. Data Studio gives us the power to blend these data sources and make a combination of data and metrics in various ways. So, today this is our topic, we will learn data blending of more than one source, and we will also learn how to perform operations on blended data.
Why use Blending Data in Google Data Studio?
Blend data is one of the features that make us transition from a basic marketing reporting tool to an advanced business intelligence solution. Features like blend data allow us to answer the questions that are most important in business intelligence, such as you are working for a client as a digital marketer, and your client asks you, what is my total ad expense? Now you are managing multiple ad campaigns and platforms like Google, Facebook, LinkedIn, and so on.
Now here, you need the blend data to feature to answer these questions, there can be so many questions like that from your client, from your boss, and maybe from your customers as well, so knowing that this is something very intelligent to use when working with Data Studio, you just need to learn how to blend data in Google Data Studio.
How to Blend Data in Google Data Studio?
So firstly, to use blend data we need to have multiple data sources, so here, I will not use any sample data sources, because they are not editable and we can face some type issues, instead, I have a custom google sheets file, in which I have three sheets, I have added dummy data for Facebook ads, Instagram ads, and LinkedIn ads on it. I will add this one sheet into Data Studio, a single sheet each time, and then we will blend this data. We will use two charts for visualizing the blended data.
Blend Data in Google Data Studio – Add Custom Sheets File to Blend Data Manually
In this first section, we will first learn how to add a custom sheets file, I have only one file with multiple sheets in it having ads data for different platforms, so you add the same file again and again, we can do that easily. Simply follow the below steps.
Step 1
Open Data Studio
Step 2
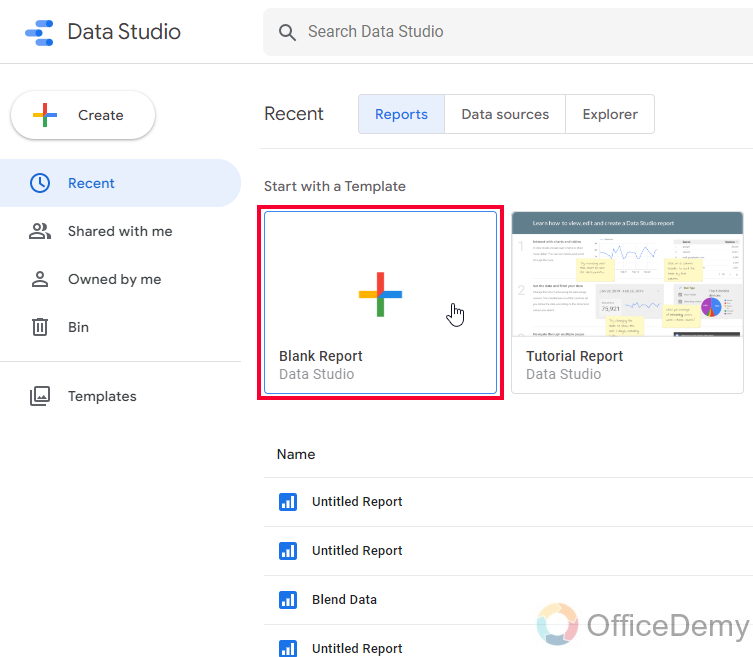
Create a blank report
Step 3
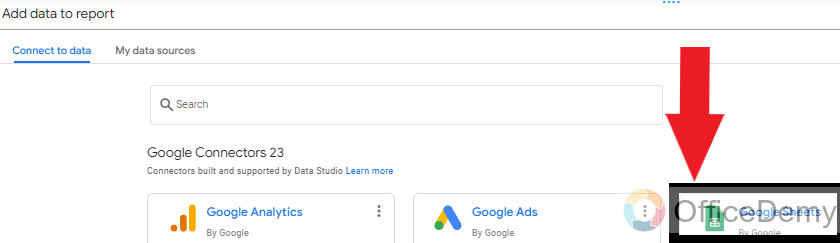
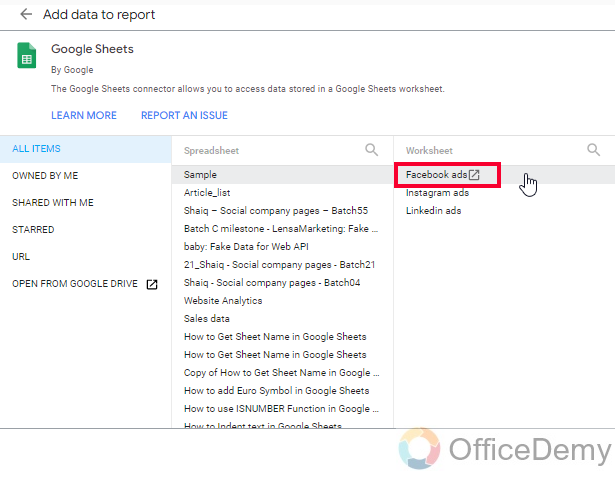
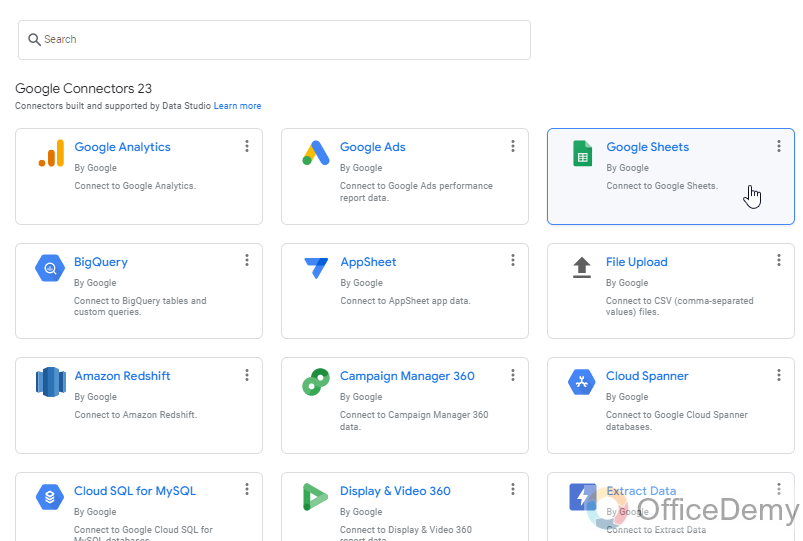
Select Google Sheets as a data source
Step 4
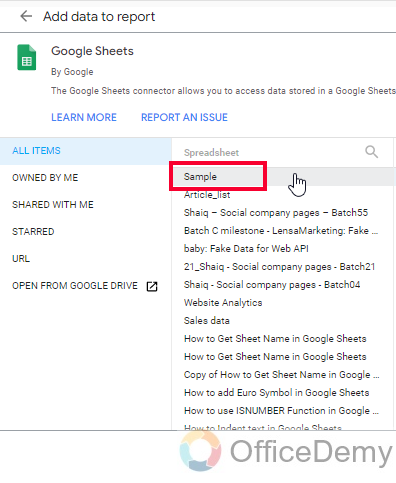
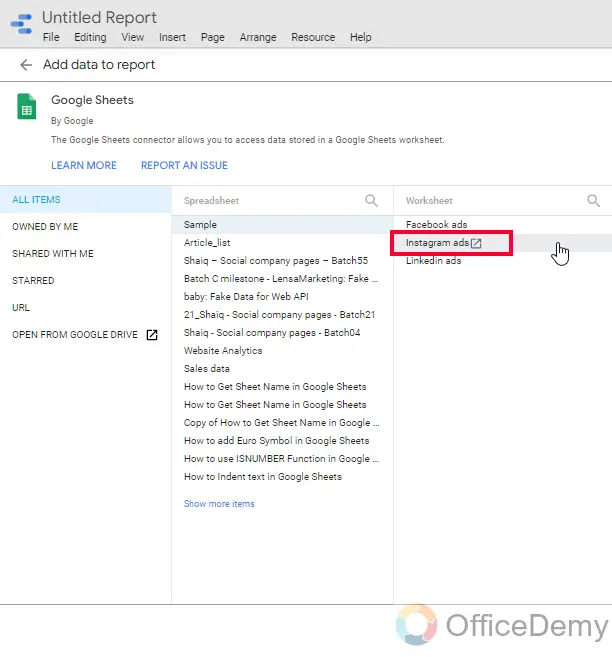
Select your file name
Step 5
Select the sheet name
Step 6
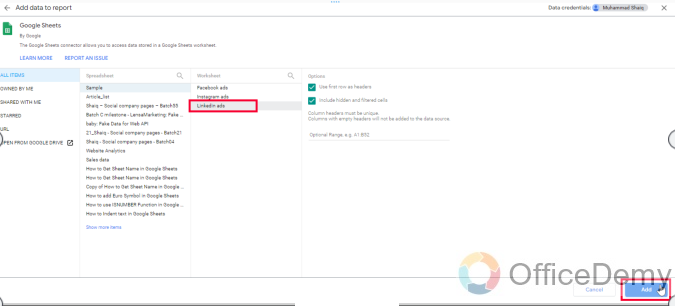
Click on Add
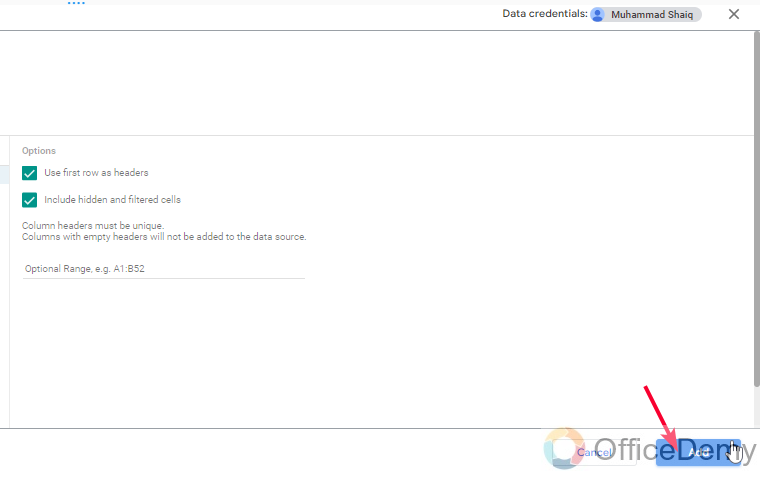
Now you have added your first sheet of that file, other sheets cannot be used inside Data Studio, so we need to add other sheets separately
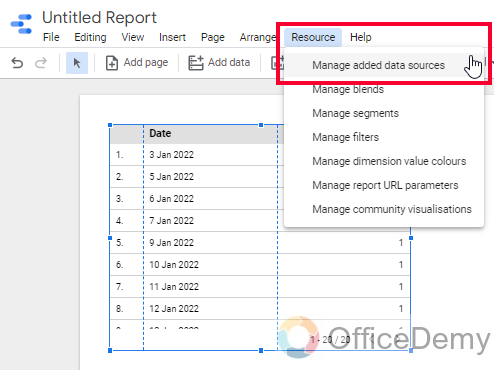
Step 7
Go to Resource > Manage added data sources
Step 8
Click on “Add a data source”
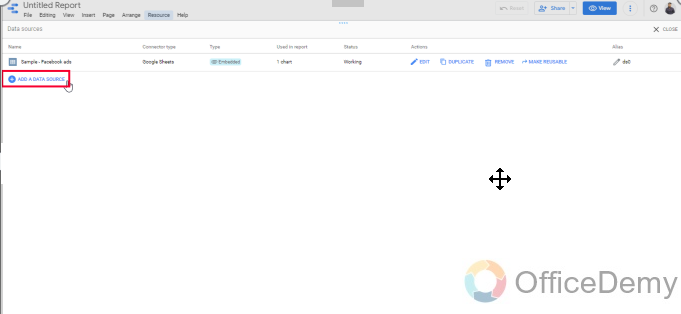
Step 9
Again, select Google Sheets > then the second sheet of your file
Step 10
Repeat steps 7-9, and this time select the third and last sheet of your file.
Step 11
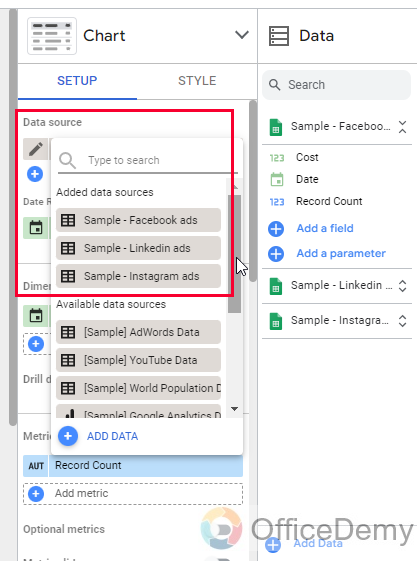
Now all three sheets have been added, you can verify here.
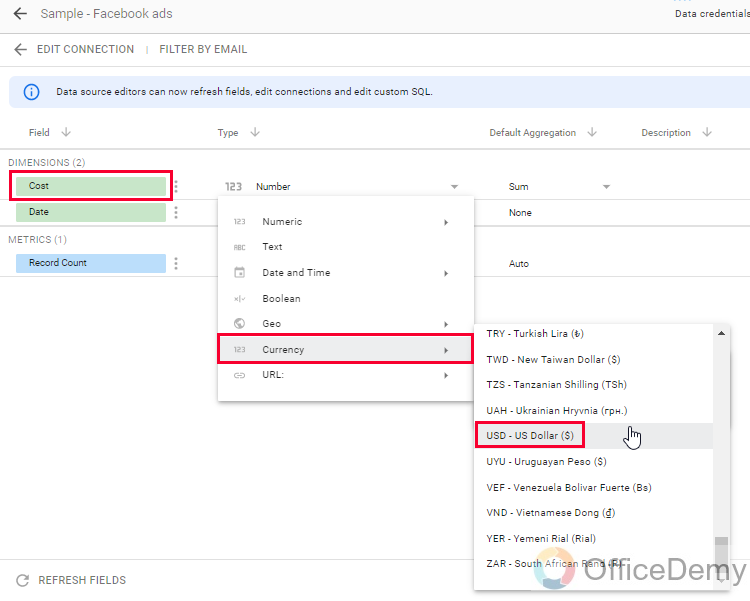
Step 12
Go to Edit, and set data types, date column to date (which is most probably already set by default), and cost, revenue, and spending as currency > any currency to all three sheets of the sample file
Step 13
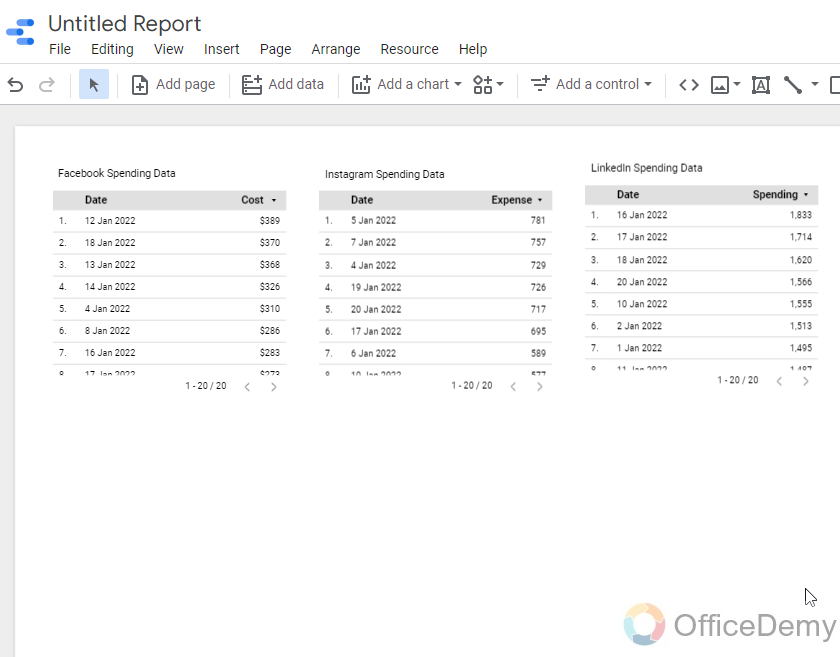
Create a table chart for each sheet with the dimension date and metric as cost/expense/spending
Step 14
Select all charts
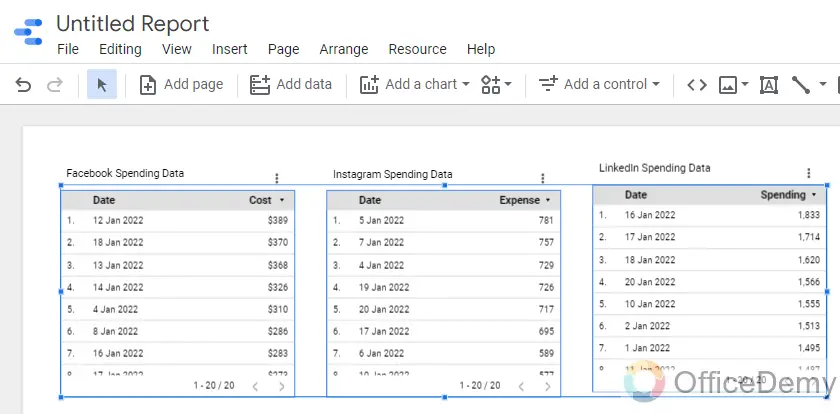
Step 15
Right click > scroll down > click on Blend data

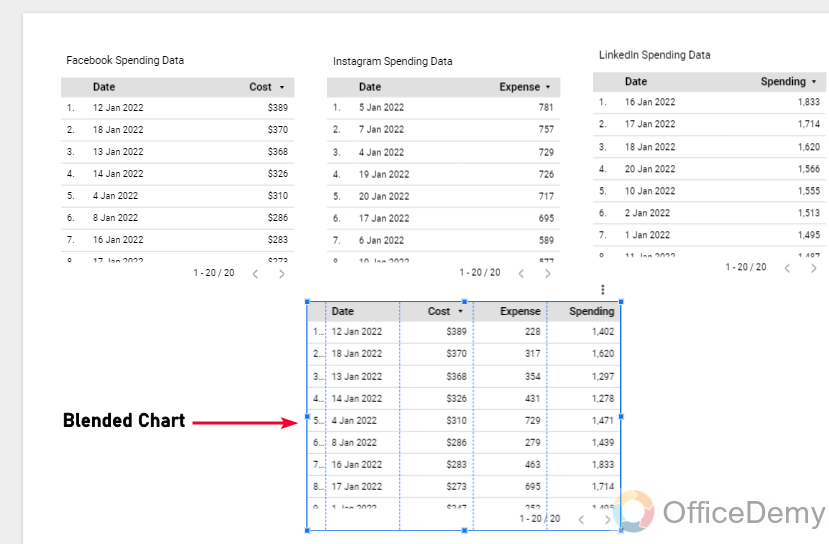
Tip: Doing this will take some load time and create a blended table chart from all three tables.
Step 16
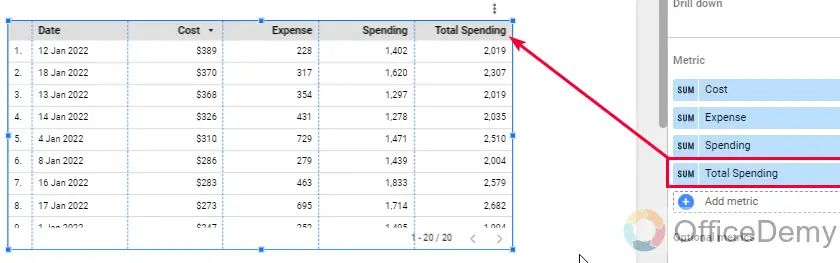
You can see your data columns and values in this chart
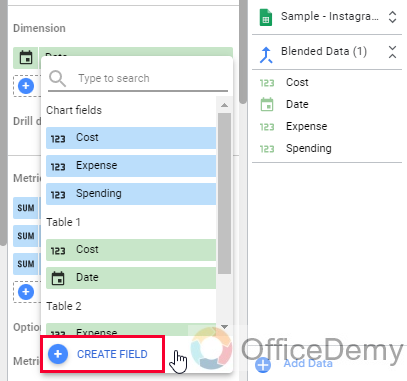
Step 17
Now let’s calculate total ad spending; for this select the blended chart > go to metric > create a field

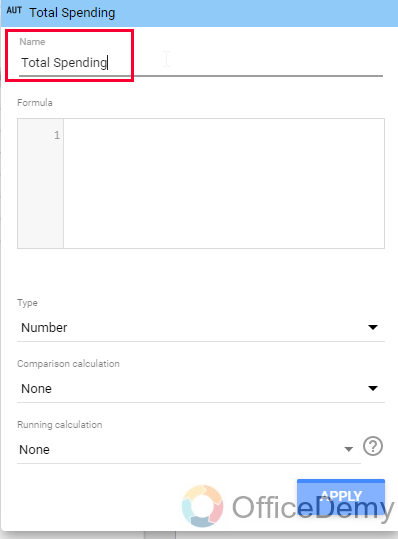
Step 18
Name your column (such as total spending, or overall cost) anything that seems meaningful
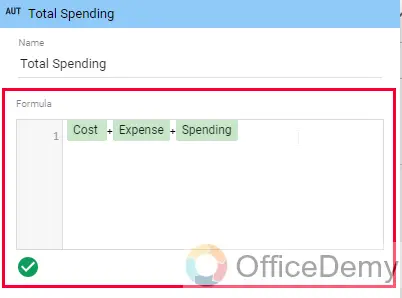
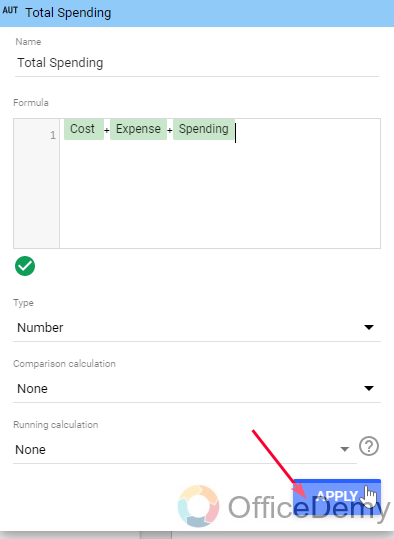
Step 19
Below, creates a custom formula that simply adds cost, expense, and spending (cost+expense+spending), and click on apply
Step 20
Now this custom field is added to your chart, and you can see the sum of all three spending values here
This is how blended data works. You can perform operations on your different data sources using this method even if they have different column names.
I hope you have understood this use case which is pretty common and useful.
Blend Data in Google Data Studio – Blend using Joins
In this section, we will learn how to blend data in Google Data Studio using the blend button, now this method can be a little complicated, in the previous method we used an easy and simple way to blend data, but here in this method, we have more options, we can determine the type of join we want to create between two or maximum fiver data sets.
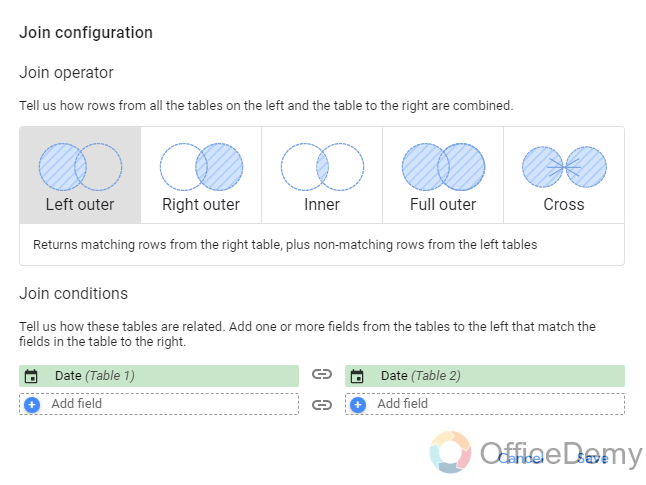
Inside blend, we have five types of joins
- Left outer join: Returns matching rows from the right table, plus non-matching rows from the left tables
- Right outer join: Returns matching rows from the left tables, plus non-matching rows from the right table
- Inner join: Returns only matching rows from the left and right tables
- Full outer join: Returns all rows from the left tables and right tables, whether they match or not
- Cross join: Returns every possible combination of rows from the left and right tables
Note: Cross joins don’t require any conditions.
We can create any kind of join among our data sources, here we can add up to 5 data sources and a minimum of two, we can also make blends and save them, and only use them when we need them. Blends can be saved just like data sources and can be managed from Resources > Manage Blends
Let’s see how to create one.
I have a Google sheets file that has three sheets:
- Facebook ads
- Instagram ads
- LinkedIn ads
Note: note that my sheet’s data has the same column names, because most of the joins require to have the same column names.
There can be many methods to initiate making a blend data set, let’s see the simplest one
Step 1
Open an empty canvas (having data source already connected)
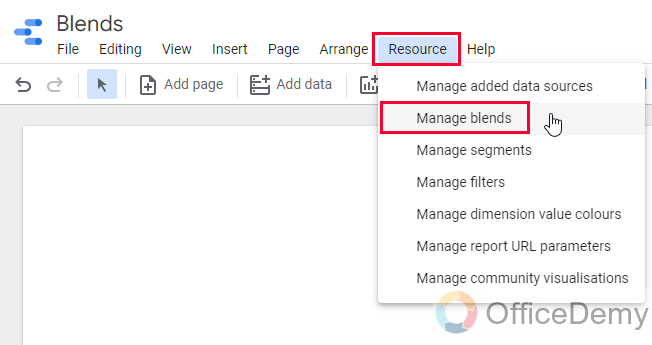
Step 2
Go to Resource > Manage blends
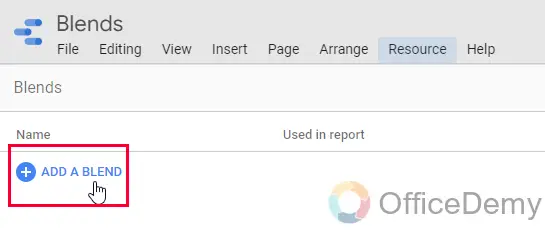
Step 3
Click on “Add a blend”
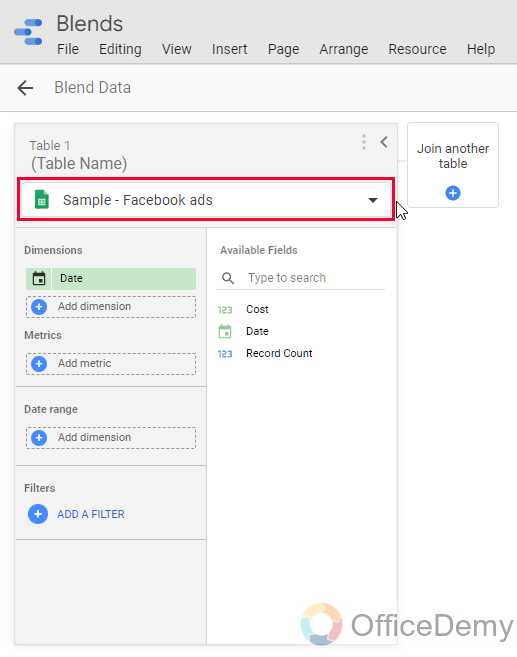
Step 4
Select your data source
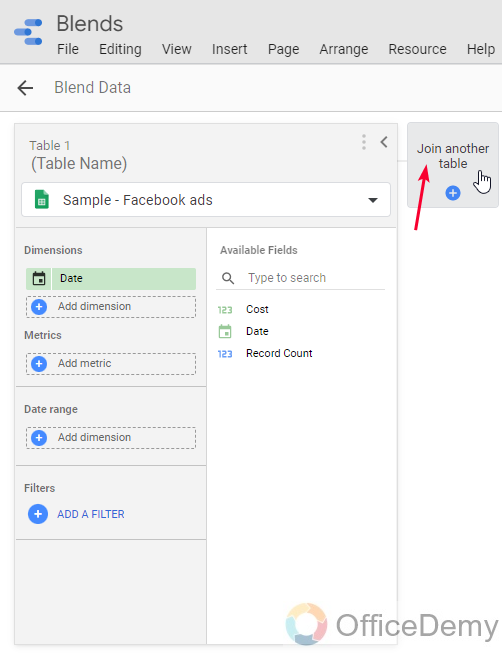
Step 5
Click on join another table
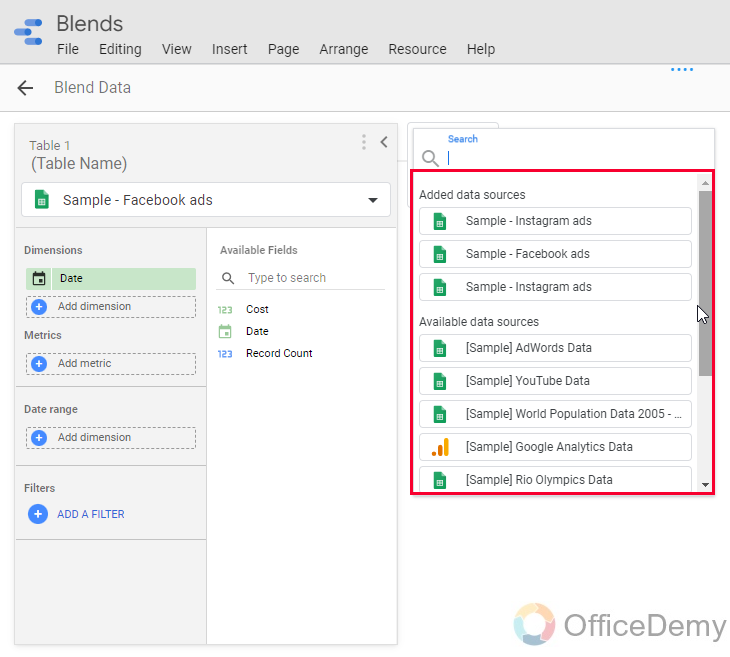
Step 6
Select another data source to create a join
Step 7
Two data sources have been selected; you can add up to 5 by repeating step 5
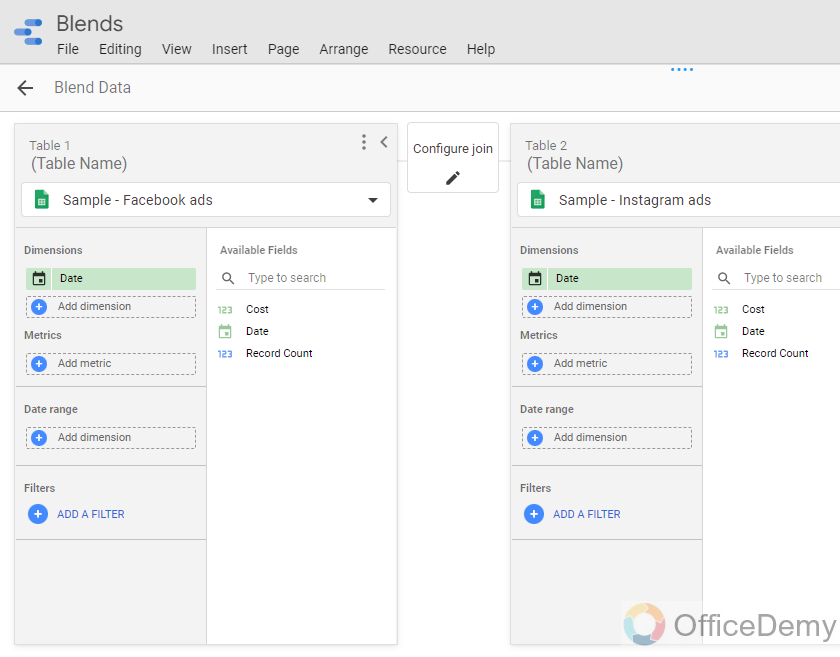
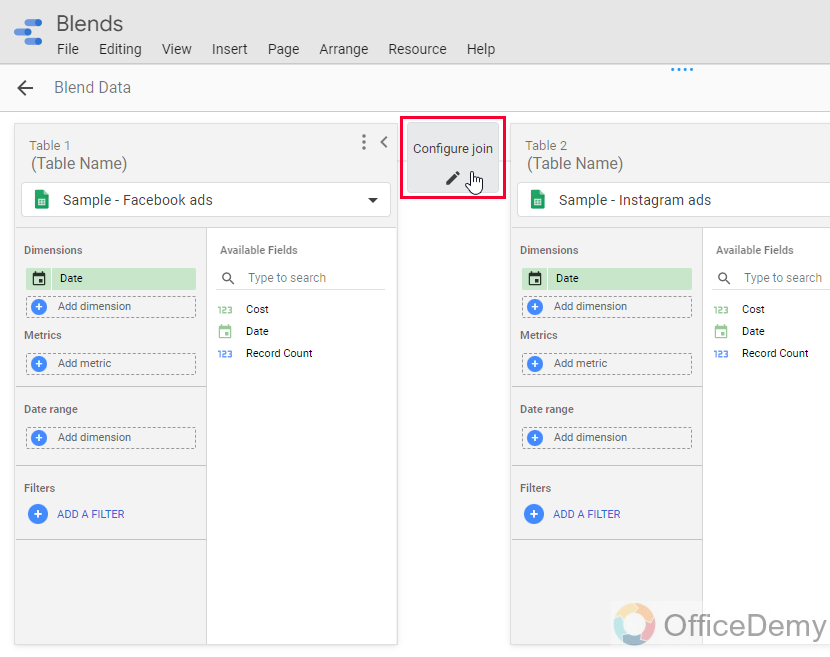
Step 8
Click on “configure join”
Step 9
Select a type of join
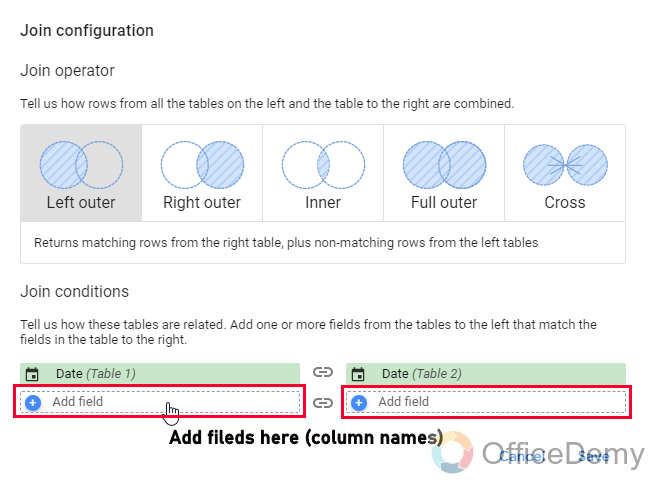
Step 10
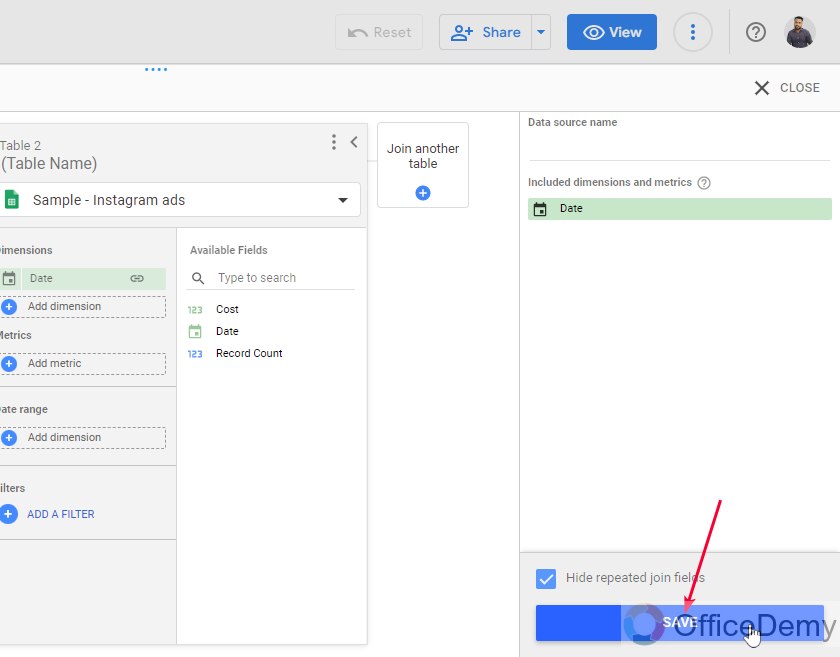
Add fields
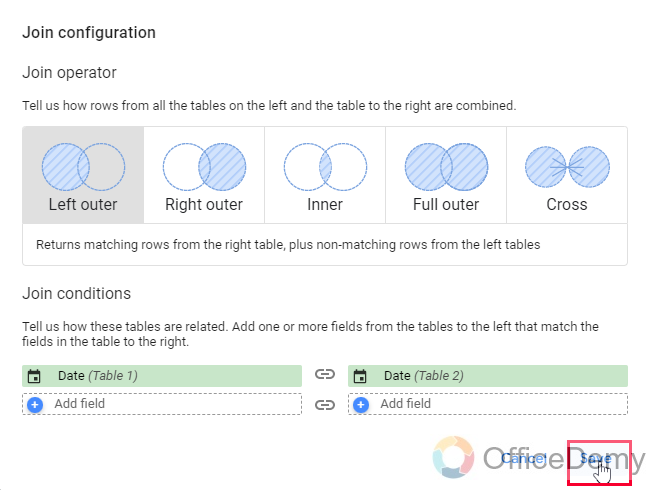
Step 11
Click on the Save button, again click on the Save button
Step 12
Click on Close
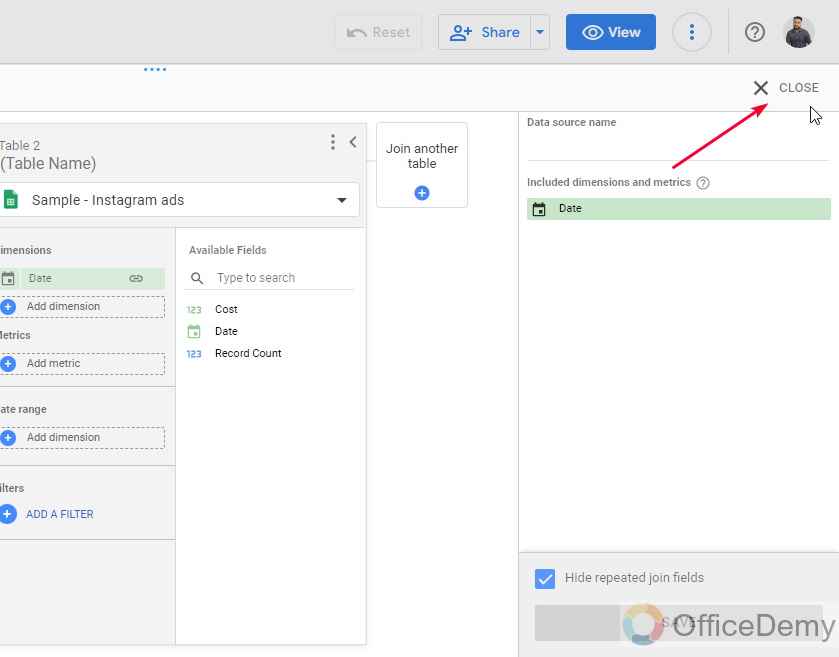
Step 13
Your blend has been created; you can use it on data sources just like charts
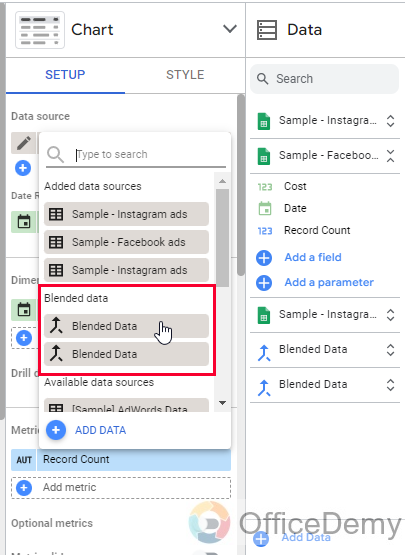
This is how you can save these blends and use them whenever you need them.
You can also create a blend using charts, selecting any chart will give a blend option in the Chart box you can click on it and add more data sources with it to make a blend.
Important Notes
- You can add up to 5 data sources by blend feature (custom or sample)
- Blend data works on all charts and tables
- Blends can be edited or deleted from Resource > Manage blends
- Most of the joins don’t allow different column names, so the first method by right-clicking and blending is pretty useful in that case when you don’t have the same column names.
- If you have different column names, and you want to use join on it, you can simply create a metric by creating a field, and then in the formula you can simply write the formula as a previous column name and assign its value to a newly created field, doing this will do nothing, but you can have a different column name without making a change in original data
Frequently Asked Questions
What is a blend in Google Data Studio?
Blend simply means to mix your data, you may have multiple data sources, and they may have some similar data points, for instance, you have Facebook ads data, and Instagram, ads data, in both data sets you must have a metric that is defining cost per conversion.
So, using blend you can group this data and can get insights of total ad spending regardless of the platform. The blend can also be used for various purposes, and they can be saved internally in your file and can be used only if you need them, there can be an endless number of blends in your one data studio report and they are on report level, no viewers can see them.
What are joins in data blending in Google Data Studio?
Joins are like general database joins, in SQL or MC Access we have some joins to join data, Data Studio Blends have some similar nature of joins, they are of five types and can be used to blend data more precisely and more specifically.
Joins have some requirements, which means that you cannot join two data sets that have distinct column names or metric names, they will not identify a different column name or metric name when you try to create a join between them. I have told you a trick above in the notes section for doing this without even changing your original data.
Conclusion
So, this was how to blend data in Google Data Studio. I hope you have learned about blends, and now you don’t have any confusion regarding this topic in Google Data studio. I will see you soon next time with another helpful tutorial. Keep learning Google Workspace with Office Demy.


