
To Find R2 in Google Sheets
Salary vs. Hours Worked:
- Input data: Hours worked (A2:A11) and salary (B2:B11).
- In an empty cell, use =RSQ(B2:B11, A2:A11).
- Press Enter.
- The result (e.g., 0.183) is the R2 value, explaining 18.3% of salary variation.
Study Hours vs. Exam Results:
- Input data: Study hours (K2:K13) and exam results (L2:L13).
- In an empty cell, use =RSQ(L2:L13, K2:K13).
- Press Enter.
- The result (e.g., 0.4024) reveals 40.24% of exam result variation explained.
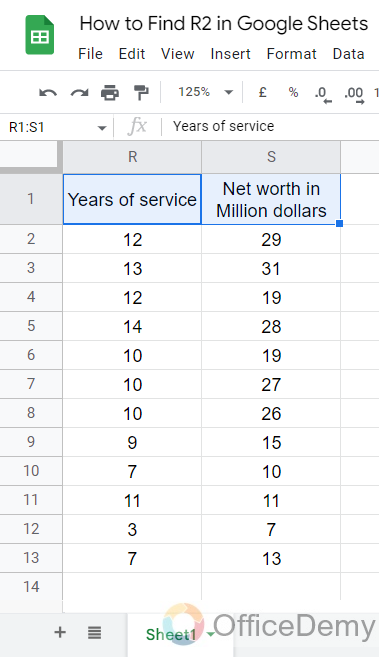
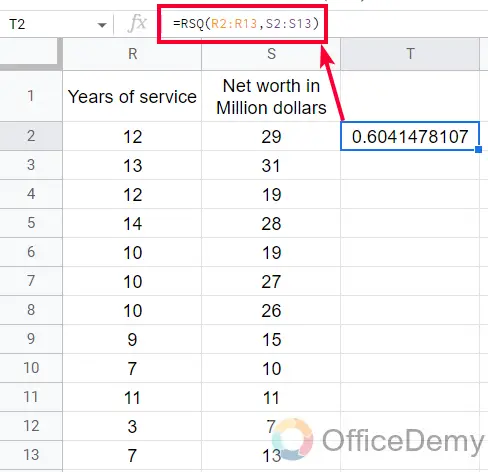
Years of Service vs. Net Worth:
- Input data: Years of service (A2:A13) and net worth (B2:B13).
- In an empty cell, use =RSQ(B2:B13, A2:A13).
- Press Enter.
- The result (e.g., 0.604) shows 60.4% of net worth variation explained.
In this article, we will be little towards statistics and we are going to learn how to find R2 in Google sheets. The first question that arises is what R2 is, and why we need it. Well, In technical terms, R2 or R-squared is the proportion of the variance in the response variable that can be explained by the predictor variable. Its R-squared, also written as r2, is a measure of statistics that tells us how well a linear regression model fits a dataset.
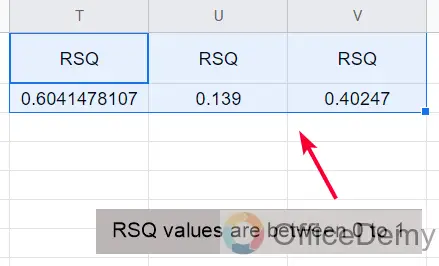
Another important thing to know is that the value of R2 can be from 0 to 1 only. The zero value (0) means that the response values can not be described or explained by the predictor variable. The one value (1) means that the response value can perfectly explain or describe the predictor value, and all other values may vary from “can’t explain” to “can explain” to “can perfectly explain“. I hope you got the basic idea of what R2 is, a good thing is that we have a native built-in formula inside Google sheets to calculate R2, and it has a simple syntax we will see below.
What is R2 in Google Sheets?
R-squared or R2 is a measure of how perfectly a linear regression model “fits” a dataset It used two variables one is a predictor variable and the other is a response variable. R2 is a statistical term used in statistics to work with linear regression which is now used in Machine learning as well, this is a very useful term that is used to predict results and make sure the data points meet the overall dataset.
R2 is also commonly known as the coefficient of determination, R2 is the proportion of the variance in the response variable that can be explained by the predictor variable based on the value. The value of R2 can range from 0 to 1, the values towards 1 explain that the response variable can be explained without error by the predictor variable.
How to Find R2 in Google Sheets?
First, let’s understand the theoretical concept behind R2. Let’s suppose you have a dataset that has the population size and number of dairy shops in 30 different cities in the US. Now you have a simple linear regression model for the dataset, using population size as the predictor variable and dairy shops as the response variable. In the output of the regression result, you see that R2 = 0.2. This indicates that 20% of the variance in the number of dairy shops can be explained by the population size. Let’s do it practically to understand its usage and application in the real world.
How to Find R2 in Google Sheets – Example 1
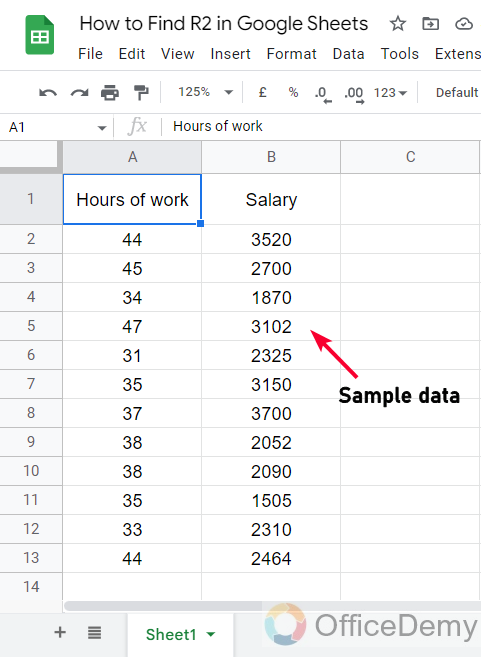
In this example we will see sample data and will calculate R2 for that data, here I have the data for employees who worked x hours in a month and got y salary at the end of the month, this is my data for 10 employees. We will calculate R2 for this data set.
Now, let’s say we want to add a simple linear regression model, using “hours of worked” as the predictor variable and “salary” as the response variable.
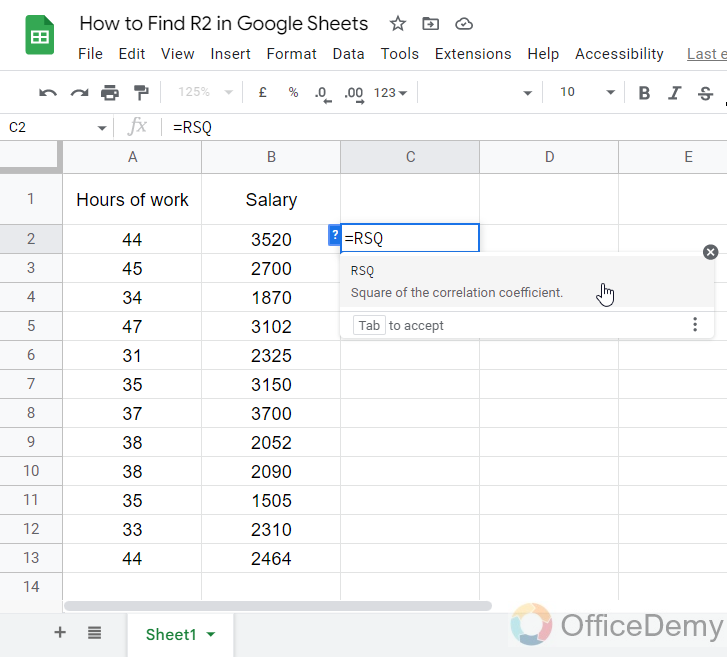
To find the R2 for this model, we can use the =RSQ() function in Google Sheets, which is a native built-in function to find the R2 value for a particular dataset that must have at least two variables.
Syntax:
RSQ(data_y, data_x)
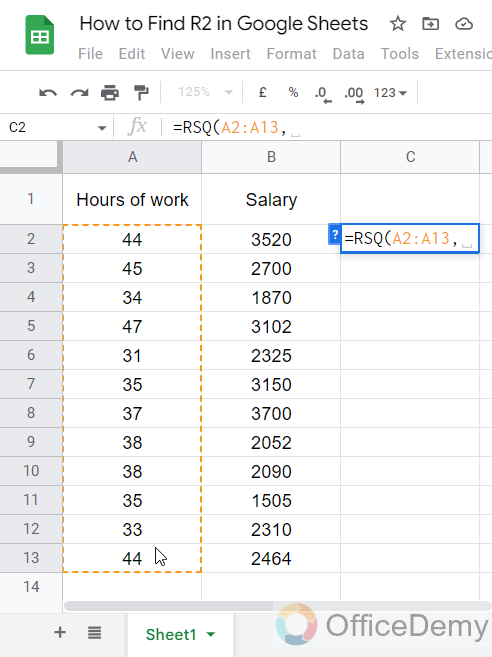
- data_y: It is the data range representing the array or matrix of dependent data.
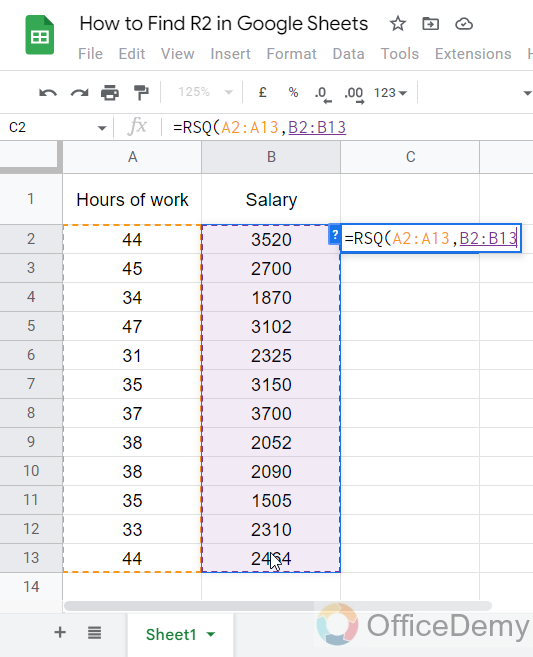
- data_x: It is the range representing the array or matrix of independent data.
- Note: Any text value(s) that occurred in the arguments passed will be ignored by the function
Step 1
Sample data
Step 2
Write the =RSQ function in any cell
Step 3
Pass the first argument (the data range for the predictor variable)
Step 4
Pass the second argument (the data range for the response variable)
Step 5
Press Enter key, and you will get a value between 0-1
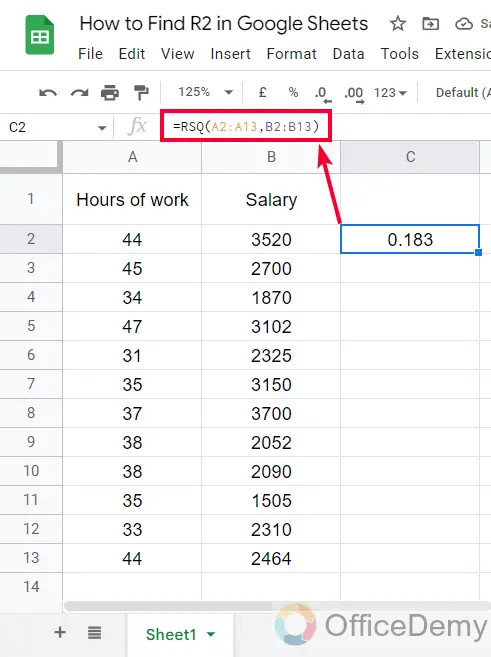
The R2 value we got from our sample data set is 0.183
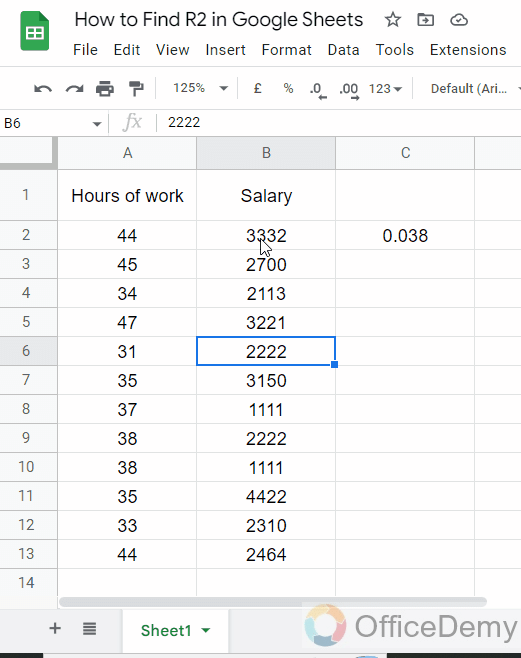
You can randomly change the values to see the changing effect on the R2 value
This means that 18.3% of the variation in the salary array can be explained by the number of hours worked.
I hope you find this example helpful. Hence, we have got R2 which is the Pearson product-moment correlation coefficient of a dataset.
How to Find R2 in Google Sheets – Example 2
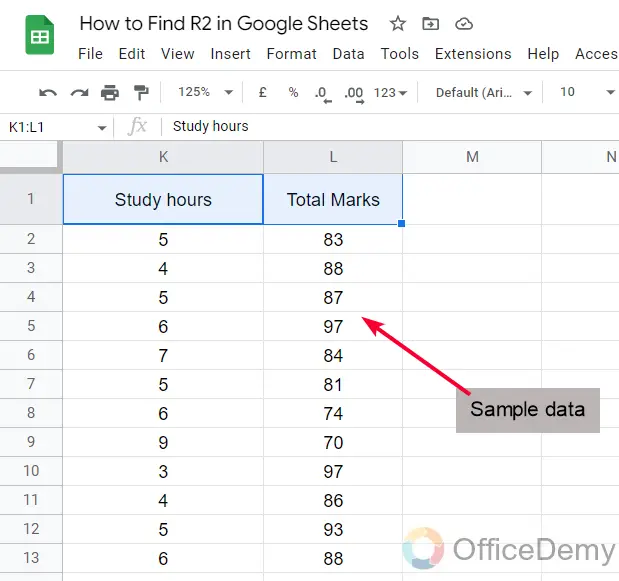
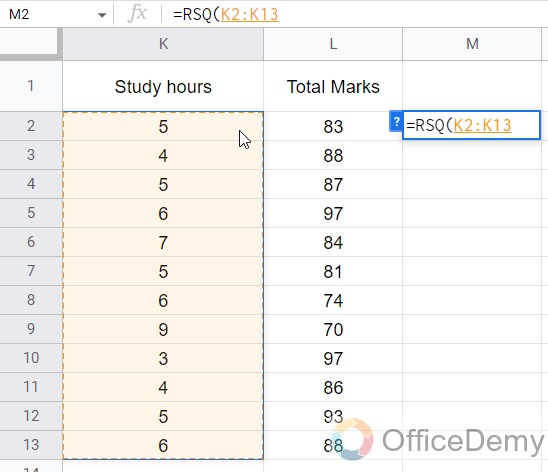
In this section, we will see another example of finding R2 in google sheets using the built-in RSQ function. We have a data set in which we have 12 students with their number of study hours and their final exam result out of 100, it’s a similar example to the previous one but here the values can be more varied because every student has their unique learning speed and memory. So, let’s see what result we get from that example.
Step 1
Sample data set, I have hours of study in Column K, and total obtained marks in Column L
Step 2
Write the =RSQ function in any cell near your actual data
Step 3
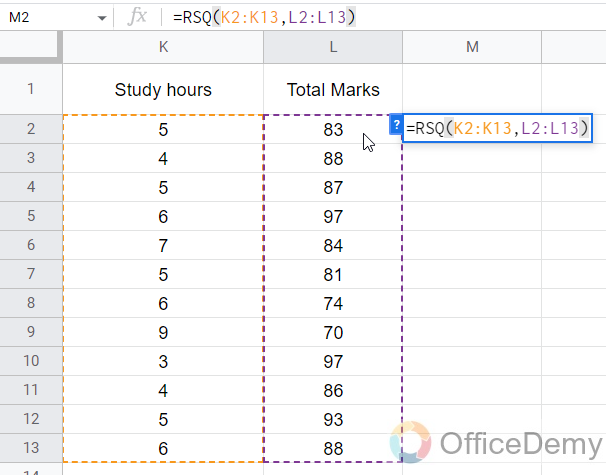
Now you need to pass the range of predictor variable as the first argument
Step 4
Now the next argument is going to be the response variable data range which is column B
Step 5
Our formula is ready now you can press the Return key to see the result.
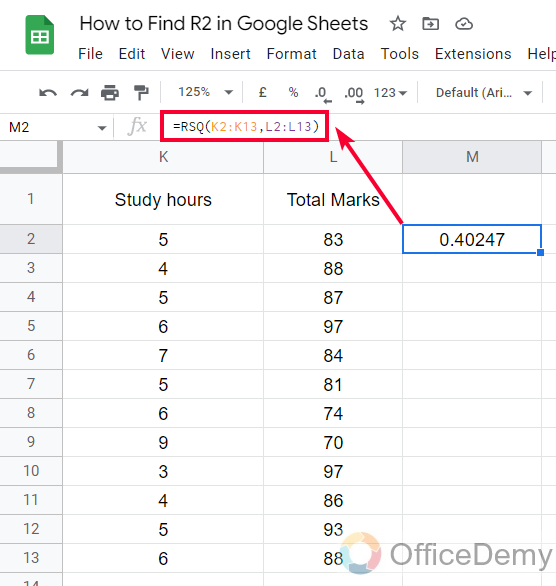
Here is what we got; we have a “0.4024” value which ultimately means that 40.24% of the variation in the marks can be explained by the number of Study hours.
Now I believe you have got it perfectly, now you have got a good idea about R2, how it works and why we need to use this in statistical projects when working in Google sheets.
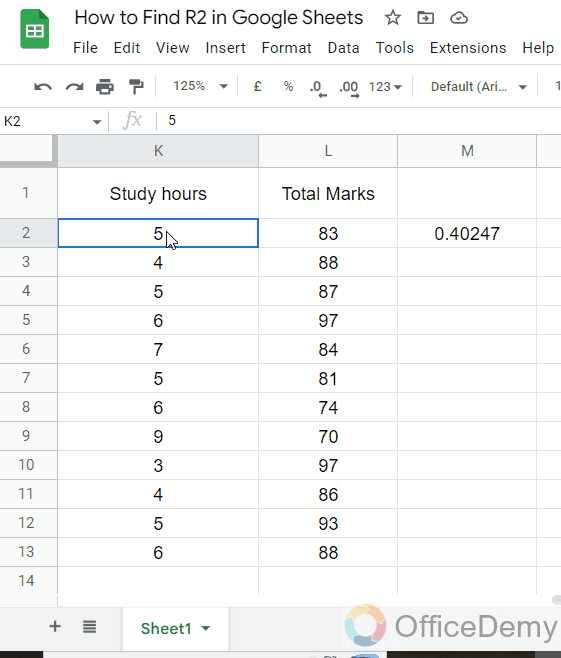
You can also see the effect on the R2 values when I randomly change the values of response variables
How to Find R2 in Google Sheets – Example 3
Another example to increasing the level of your understanding. In this example, we have sample data in which we have the number of years of service, and the overall net worth of an independent contractor in the USA.
Finding R2 for this data set is helpful to understand the data and we can find how perfectly or badly we can predict the response value using predictor value.
Step 1
Sample data
Step 2
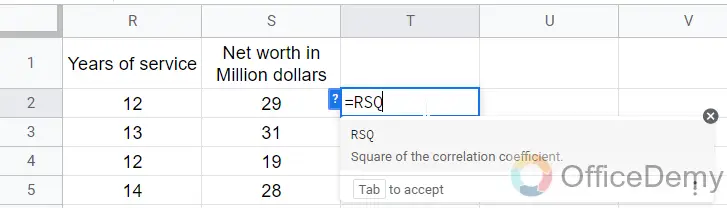
The function of any cell
Step 3
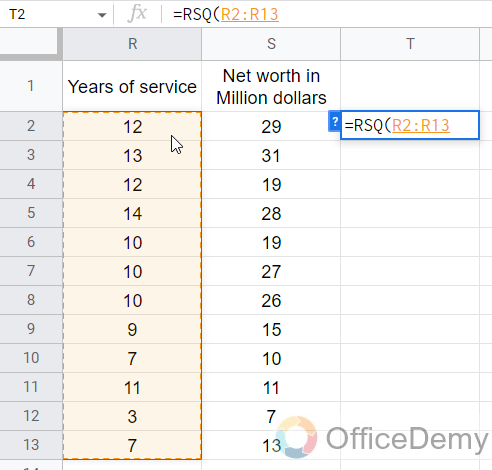
The first argument which is “Years of service” you need to pass the entire range
Step 4
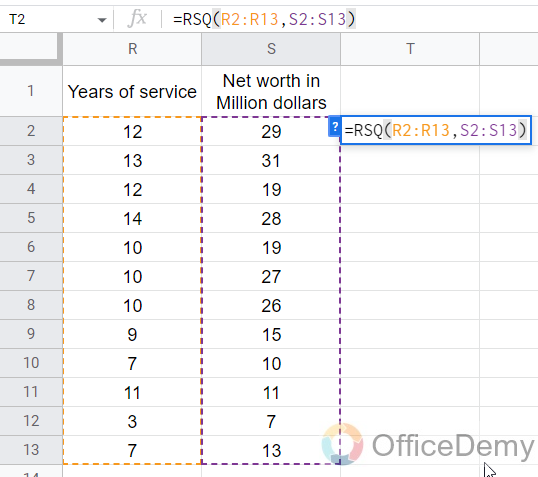
The second argument is the net worth which is column B, passing the entire range
Step 5
The formula is completed, Press Enter key to get the resultant value
So here we got 0.604 which is 60.4% in percentage. Now, I believe you know what the conclusion is.
The value is “60.4%” which means that 60.4% of the variation in the “Net worth” can be explained by the number of years of service from the contractor.
I taught you three examples that are a little similar but have different results each time, it’s because of the variance between the values and between the combination of values between two columns. This is R2 works. You have seen finding R2 is straightforward in Google sheets, but understanding the concept behind it is very important that’s why I emphasized the basics in the introductory section.
I hope now you have learned what is R2 and how to find R2 in Google Sheets.
Download/Copy Google Sheets Workbook
Important Notes
- A value of 0 or near 0 indicates that the response variable cannot be explained by the predictor variable by any means
- A value of 1 or near 1 indicates that the response variable can be perfectly or at least nicely explained without error by the predictor variable by any means
- R2 is also written as r2 or R-squared or RS, or RSQ. In Google sheets, we call it RSQ because it’s the function name.
- You will probably never see a value that is exact 0 or 1 for R2, instead, you will get some mid values between 0 and 1 as we got 0.2, 0.4, and 0.6 in our practice examples
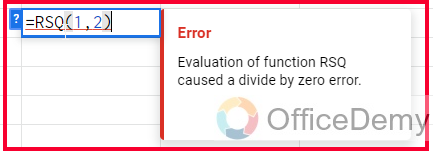
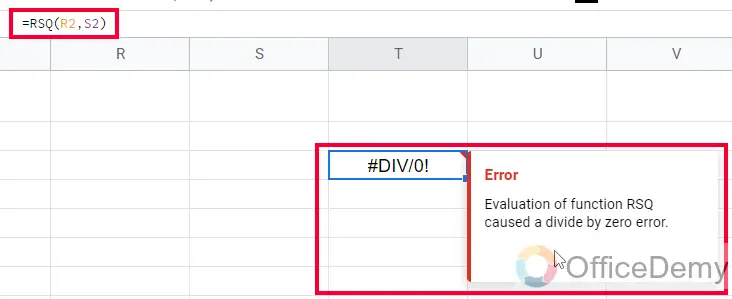
- An error will occur if you pass two single values as two arguments of the RSQ function
Frequently Asked Questions
What is a good R2 value?
The answer to this question depends on your goal for the regression model.
There can be two most likely objectives
You are looking to explain the relationship between the predictor(s) and the response variable?
OR
You are more interested in predicting the response variable?
Thus, depending on your goal, the answer to “What is a good R2 value?” will be different.
What is the relationship between the response and predictor variable?
If your primary goal is to explain the relationship between the predictor(s) and the response variable, the R2 is mostly irrelevant.
Let’s suppose in the regression model example from the above examples we learned, you see that the coefficient for the predictor population size is different every time and that it’s statistically valid because we are using different data values on the same pattern of population data, which means that an increase of ++1 in population size is associated with an average increase of 0.005 in the number of dairy shops in the USA. note that the population size is a statistically important predictor of the number of dairy shops at any location.
Conclusion
So today we learned a very fine statistical concept which is R-squared, or R2 in common words. We learned how to find R2 in Google sheets using three different examples, we also tried to learn about its theory and the logic behind this important statistical or mathematical concept. I hope you have got the answers to your questions, for more learning tutorials and handy tips and tricks, keep in touch with Office Demy.


![How to use PERCENTILE Function in Google Sheets [Beginner’s Guide]](https://www.officedemy.com/wp-content/uploads/2022/09/how-to-use-the-PERCENTILE-Function-in-Google-Sheets-8h-1-336x220.png)