![How to use PERCENTILE Function in Google Sheets [Beginner’s Guide]](https://www.officedemy.com/wp-content/uploads/2022/09/how-to-use-the-PERCENTILE-Function-in-Google-Sheets-8h-1-661x350.png)
To use the PERCENTILE Function in Google Sheets
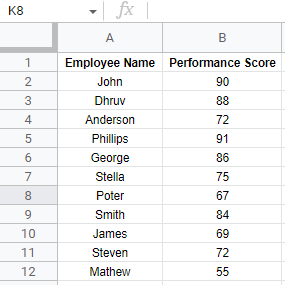
- Input the sample data, with employees’ names and their performance scores.
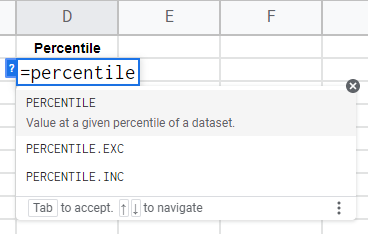
- Write the PERCENTILE function in any cell.
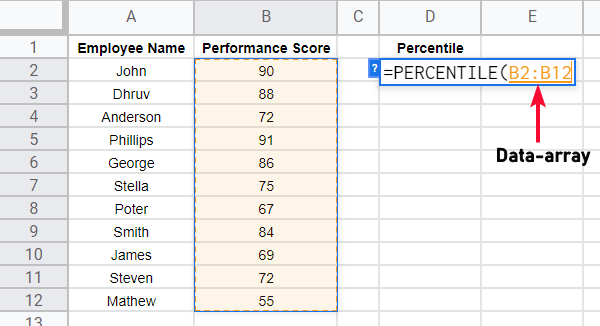
- Specify the first argument (data_array) by selecting the relevant range of performance scores.
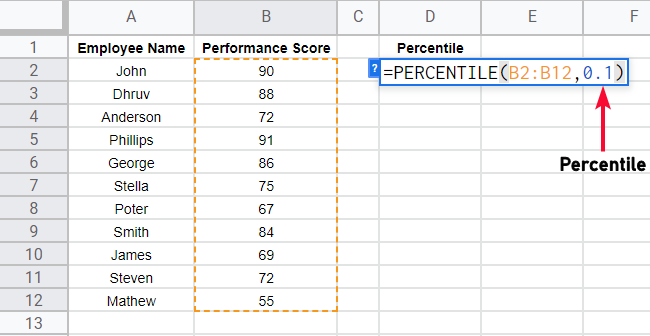
- Enter the second argument (percentile) with the percentile value you want to calculate.
- Press Enter to calculate the result.
Hi. In this article, we are going to learn how to use the PERCENTILE function in google sheets.
PERCENTILE function is used to get the ranks inside of an array of data. It’s not like a normal percentage. The percentage is simply for showing the number out of 100, for example, 40 percent of 200 is 80. Similarly, 10% of 200 is 20. the formula is simple (value/total value) ×100%. Whereas, the percentile is a different thing. Percentile does not give the percent from a bigger value, it gives rankings, and it tells the position of each entity in a numeric data set. For example, the performance of employees is written in a simple dataset, by using a percentage formula we can see the performance score of each employee out of 100.
Use Cases of PERCENTILE Function in Google Sheets
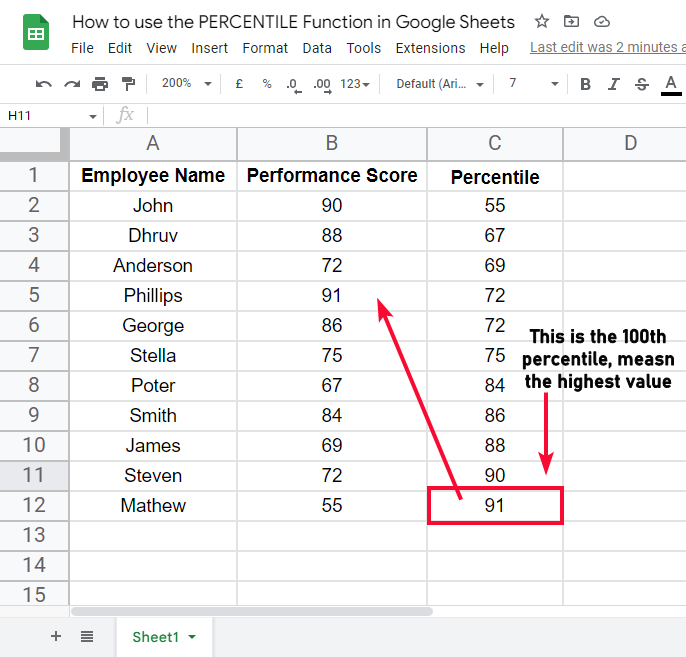
To reduce this “out of” value, we use percentile. Percentile on the same dataset will tell you each employee has performed better than X percent of employees. There is a total of 11 segments of the percentile function that we can calculate. The highest percentile will be the first employee who has performed better than all 100% of the employees, this is how we referred percentile with ranks, similarly, the lowest percentile will tell us about the employee who has performed better than 0% of employees, that simply means he has got the lowest rank.
So instead of comparing each data point to a bigger value like out of 100, or 200, what we do is compare the data point with each other and the highest percentile will be set according to other data points inside an array. Assume a real-life scenario, where to total performance marks are 50, and you have just got a message that you have got only 30 marks, you are upset, but the next day when you meet your colleagues, you came to know that all your colleagues have got below 25,.
Now here is difference between percentage and percentile. The percentage function here will not show you that the test was difficult that’s why you all have got low marks. The percentile with its ranking feature will give the first rank to you (as you have got 30 marks), without bothering that they are only 60 of the totals. This is how percentile helps us and we can perform multiple analyses on our data using this function.
I can understand this is too much to understand with theory, so don’t worry we will implement this and you will master this function after this tutorial.
How to use PERCENTILE Function in Google Sheets
Firstly, we should understand the concept behind the percentile in general meths and statistics. Google sheets have already designed this function on the mathematical and statistical rules. So, we don’t need to worry about the backend calculations, we just need to follow the simple syntax and function rules to get the result.
PERCENTILE Function in Google Sheets – The Syntax
Let’s see the syntax of the PERCENTILE function, to better understand it before we implement it.
Syntax of PERCENTILE Function
=PERCENTILE(data_array, percentile)
Here,
- data_array: It is an array or reference to a range of cell values containing the numeric data of all data points. You need to supply the entire range here – It is a mandatory argument
- percentile: It is the percentile, you need to specify which percentile you are looking for, you can pass here a percentile value which is between 0 and 1 (0, 0.1,0.2……1)
OR
you can use percentages:
- 0 is equivalent to 0%
- 0.1 is equivalent to 10%
- 0.2 is equivalent to 20%
and so on, finally
- 1 is equivalent to 100%
It is also a mandatory argument, and you cannot pass anything other than the above-defined values.
These are a total of 11 segments of percentile. 1 is the highest percentile, 0 is the lowest percentile and the rest can be said as a middle or centered percentile.
Now let’s move to a practical example to understand the PERCENTILE function practically.
PERCENTILE Function in Google Sheets – For Employee’s Performance Score
Here we will learn how to use the PERCENTILE function in google sheets for employee performance scores. We have employees’ names, and their performance scores, we don’t know out of what, and actually, we don’t need to. The function will automatically assign ranks based on the values.
Step 1
Sample data
Step 2
Write the PERCENTILE function in any cell
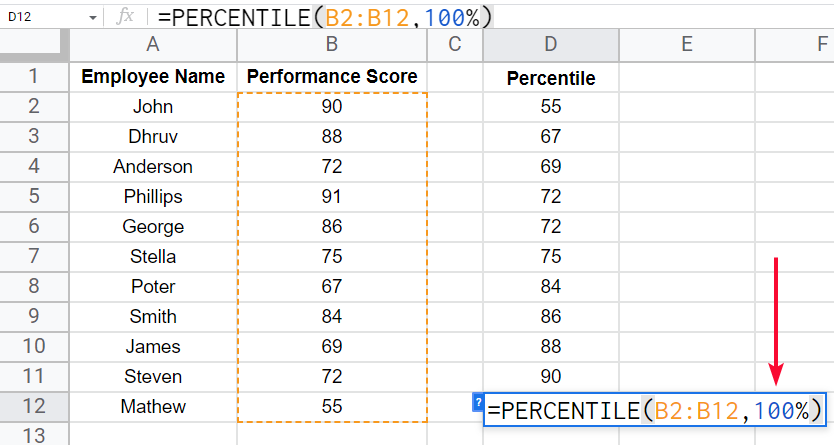
Step 3
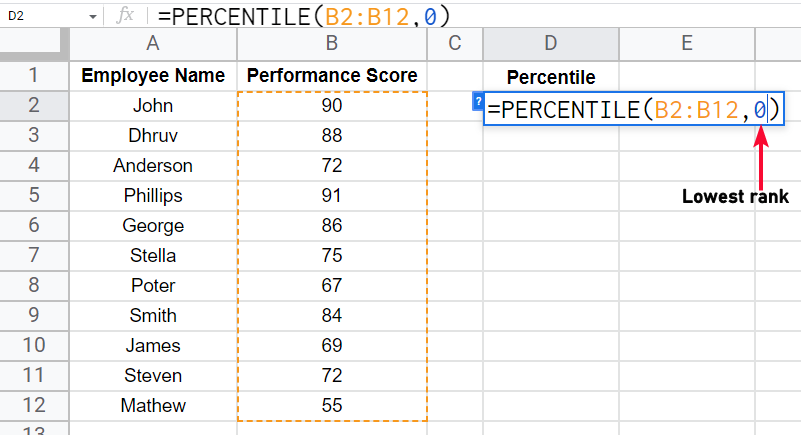
Pass the first argument (data_array)
Step 4
Pass the second argument (percentile)
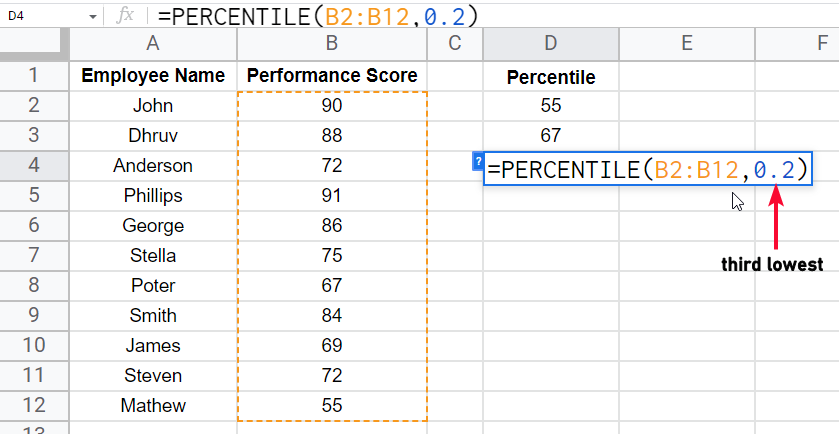
Step 5
Press Enter key, and you will get the result
Analyzing the result
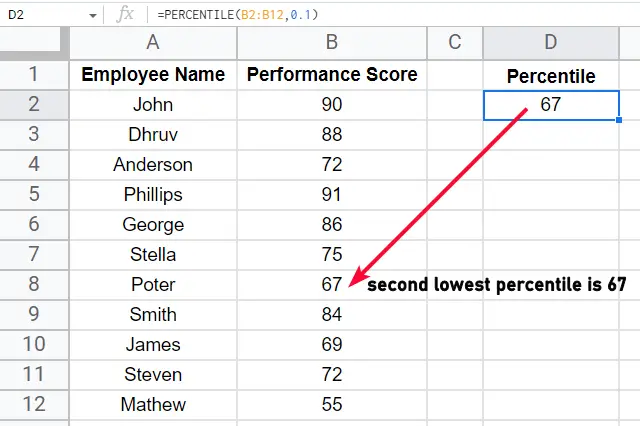
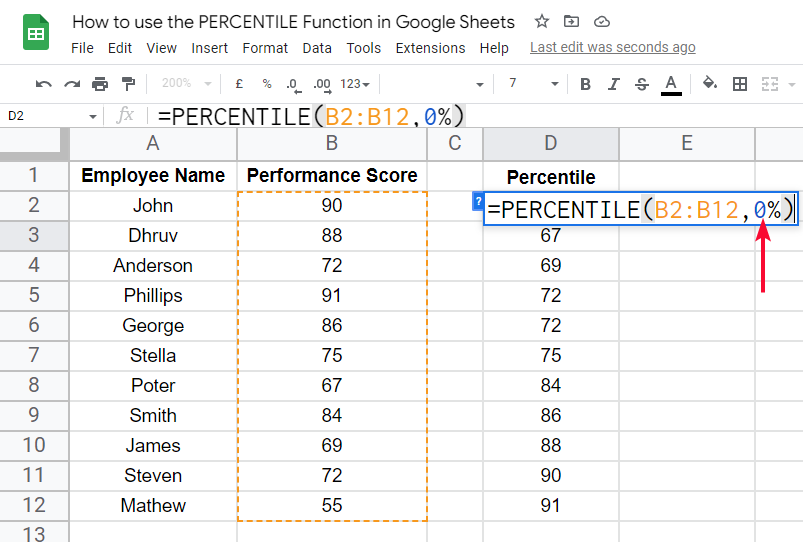
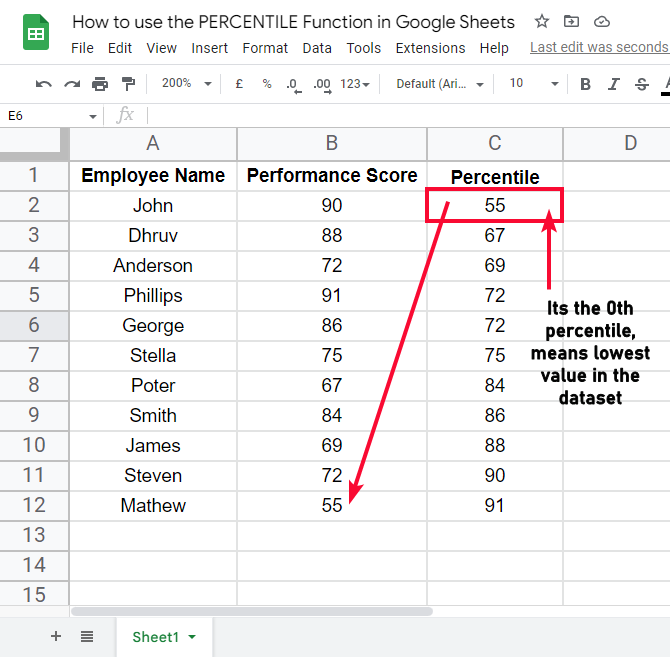
We have got a percentile let’s say, we found 0 percentile, so we have got the 0th ranked (lowest) in this dataset.
Now let’s move on, and let’s calculate all the segments of the percentile for this dataset to assign ranks to each data point (in this example: employees)
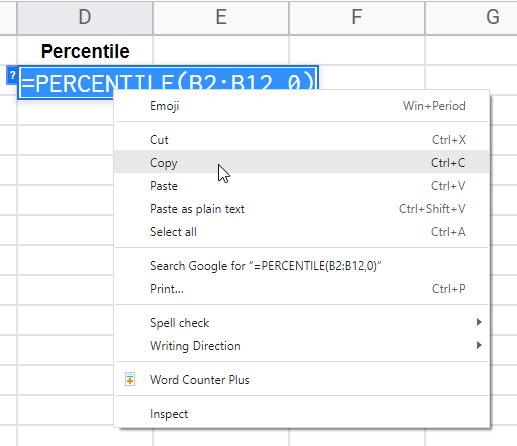
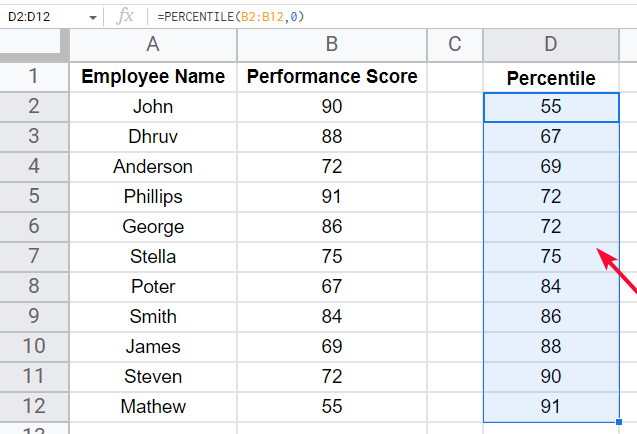
Step 6
Copy the formula
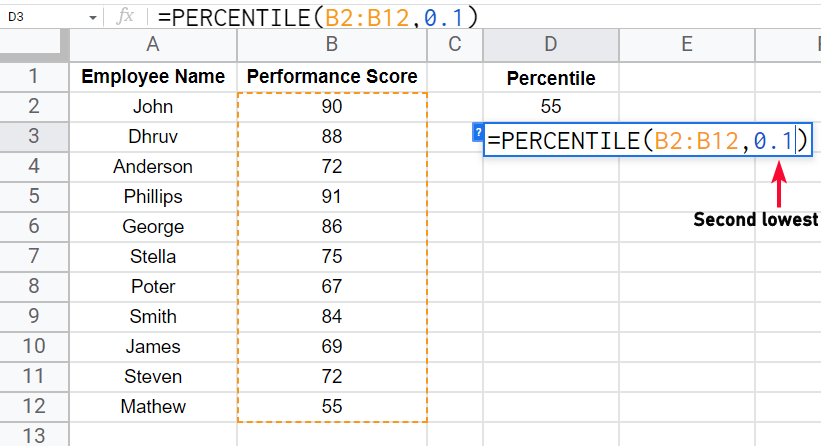
Step 7
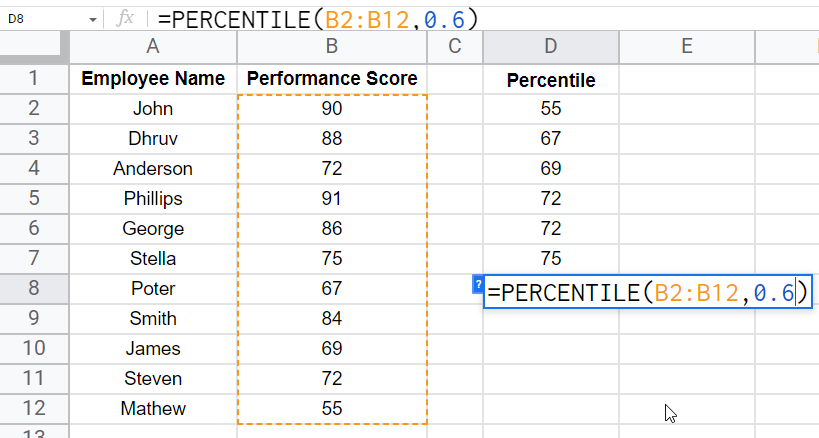
Now below sequentially, paste the formula in the next cell and change the percentile value from 0 to 0.1 (we will move ahead with each segment like this)
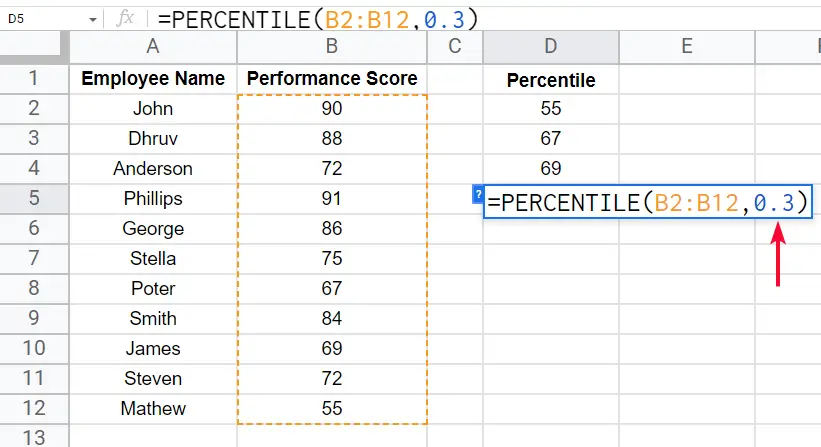
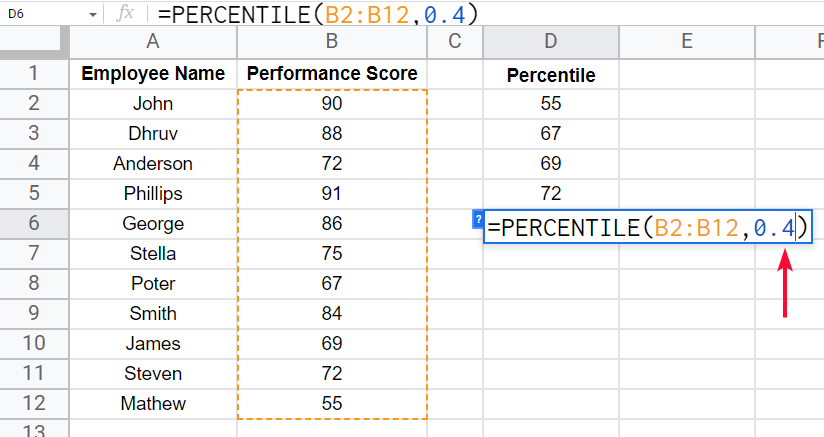
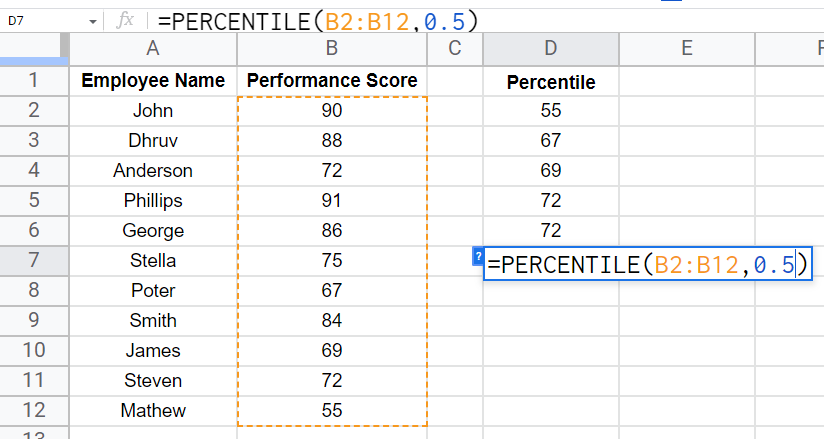
Step 8
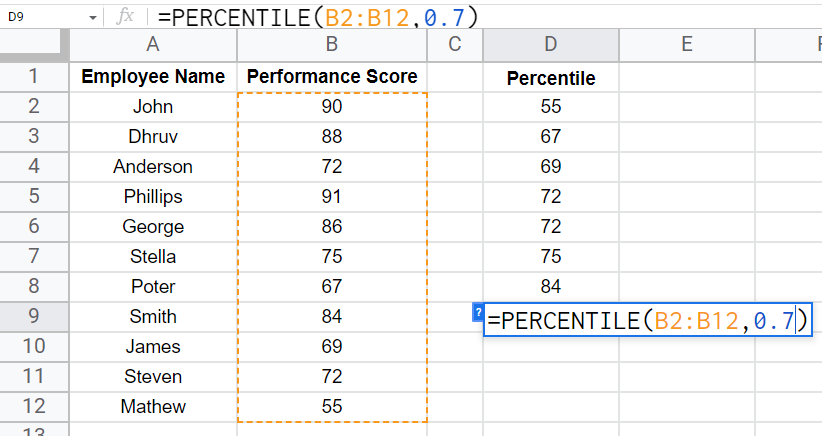
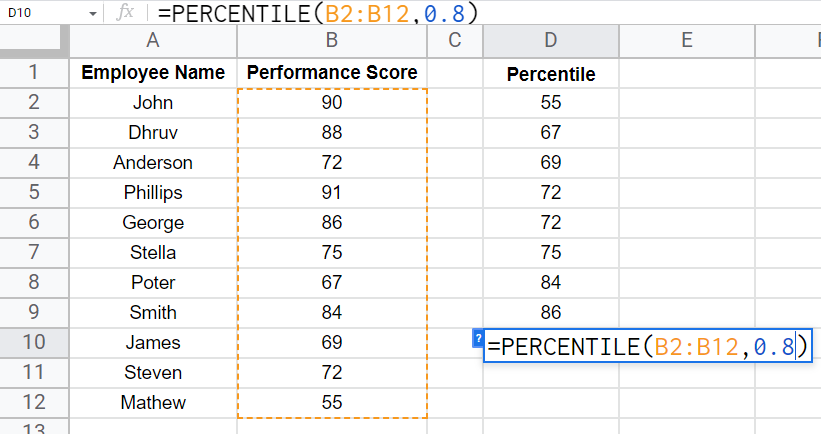
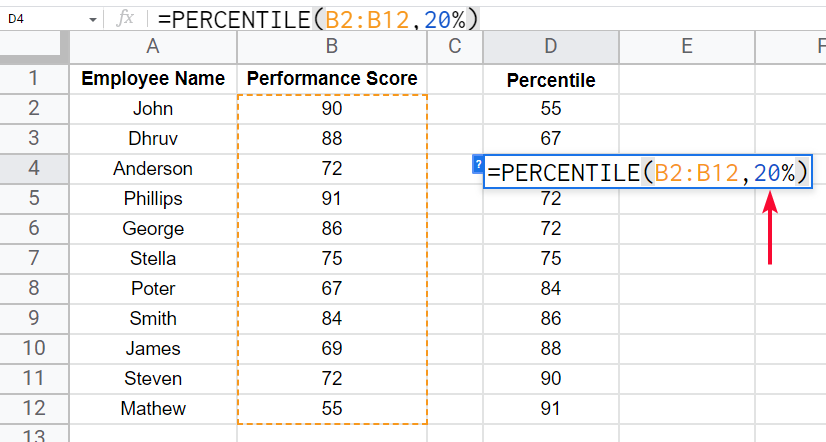
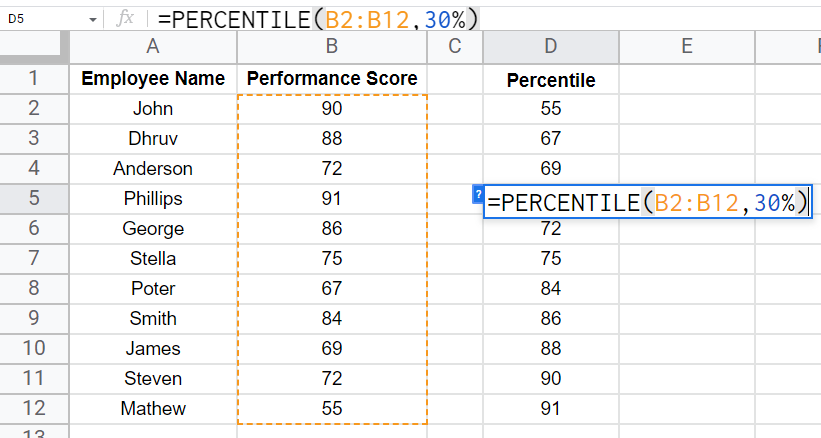
Move further and keep increasing the percentile value (now from 0.1 to 0.2 to 0.3 and so on)
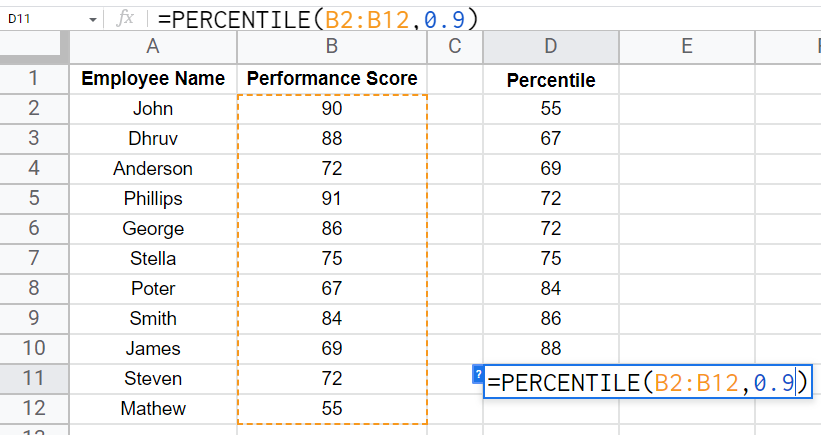
Step 9
Reach to 1 and now your overall sheet will be like this
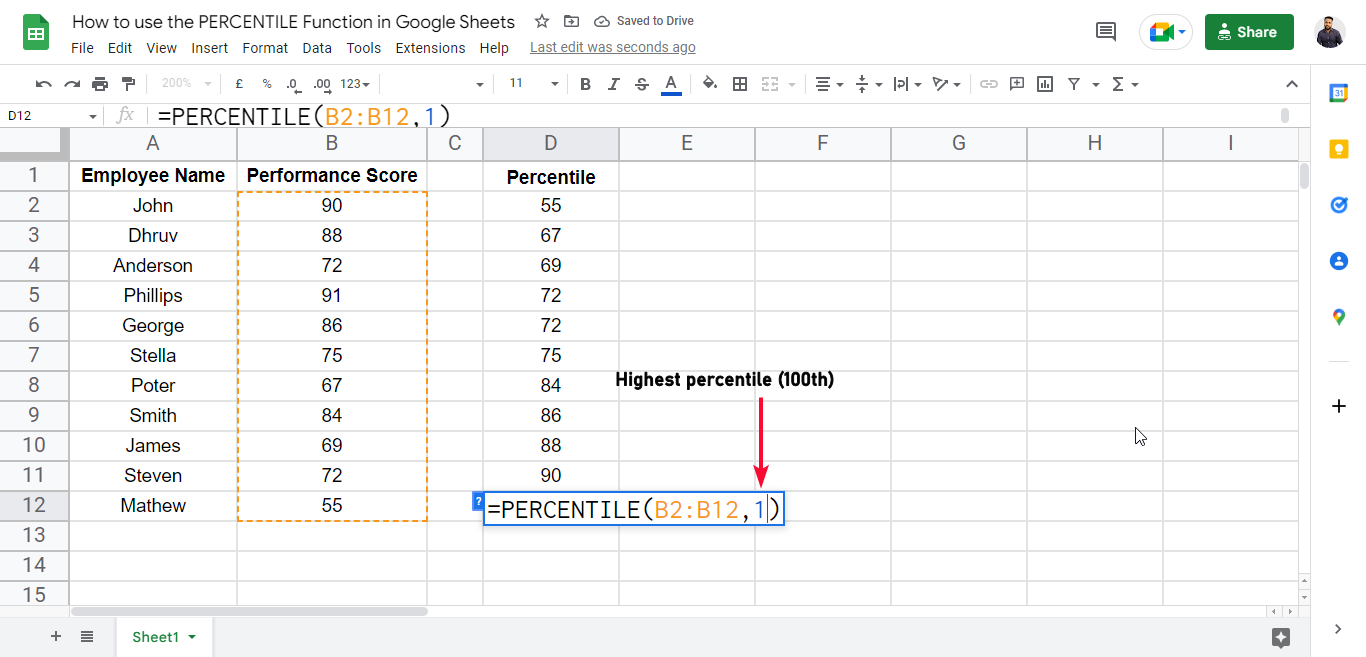
Or another way to define percentile argument is below
Note: Don’t drag the formula, it will not work. Also, you can see I am using a relative reference, and copying the formula to each cell with a different value of percentile and the range is the same.
Step 10
Now you can see the same values are calculated on each percentile formula. This shows the ranks of employees in the data set.
This is how to use the percentile function in google sheets.
You can practice this function on similar datasets, the procedure will remain the same.
I hope you find this article helpful.
Download/Copy Google Sheets Workbook
Important Notes
- Percentile gives the rank of the supplied data array values
- Percentiles can also give relative values if the values are more or less than 11
- A percentile is NOT a percentage
- Percentile can be specified by 0.1 .1 or 10%, all these three have the same meaning inside the parenthesis of the Percentile Function
- It’s a good practice to use a single format in all your functions on a sheet
- Percentile can tell you the ranks of your supplied data as the highest in the 1st percentile and the lowest in the least percentile of the data.
- In the example, we have 11 data points that are equal to the segments of the percentile to show you the same values and not show a mid or nearing value. whereas, percentile can be calculated for as many data entities as you want there is no limit to data points.
- The percentile function has some more variants in google sheets: percentile.inc, percentile.exc, and percentileif
Frequently Asked Questions
What is the percentile in google sheets?
Percentile is a function in google sheets, which is used to find the nth percentile value of any data set. The data set need to be defined inside the function along with the percentile which can be a number between 0 and 1. Percentile returns a simple value (number) which after the proper analyses can be ranked among the data points as highest or lowest or anything in between
Why do we need to use percentile in google sheets?
We need to use the percentile function in google sheets to analyze the data as per rankings, the percentile is different from the percentage, and it gives you data points ranking based on its surrounding values inside the data set. We can use it to find the top and least values in a dataset
Is the Rank function in Google Sheets similar to the PERCENTILE function?
The rank function in google sheets is not similar to the PERCENTILE function. While both functions deal with data analysis, they serve different purposes. The rank function calculates the rank of a value in a dataset, whereas the PERCENTILE function calculates the position of a value relative to the entire dataset in terms of percentiles.
Can I Use the PERCENTILE Function to Calculate Percentage in Google Sheets?
Yes, the PERCENTILE function can be used for calculating percentages in google sheets. It allows you to find the value below a certain percentage in a given range of data. By inputting the range and the desired percentile, you can easily calculate the corresponding value, making it a useful tool for percentage calculations in Google Sheets.
Is Using the IRR Function in Google Sheets Similar to Using the PERCENTILE Function?
Calculating irr in google sheets is distinct from using the PERCENTILE function. While the IRR function determines the internal rate of return for an investment, the PERCENTILE function provides the value below which a specific percentage of data falls. These functions serve different purposes and are not similar in their applications.
How can I analyze percentile values?
The percentile function required a data array as the first argument and returns the nth percentile as you specify which percentile you want to calculate. Percentile considers the highest value in the data array as the 1st percentile, so the highest value does not matter out of what? the highest value is dependent on other values for example if your data has 3 values 1,2,3 so the highest is 3, but if you change 1, and 2, to 11, and 12, the highest value is no 12, 3 is dependent on other values this is why we don’t need to compare the values from any specified value like 100 or 200, instead, the values are compared to each other and the highest value becomes the first percentile of that data array, and the 0th percentile is the lowest value and the middle segments are from 0.1 to 0.9.
Conclusion
So, this was how to use the PERCENTILE function in google sheets. We first, tried to understand the basic concept behind the function. Then we try to know why we use it and how it’s different from the percentage. We saw a practical example of a data set where we had employees’ performance scores out of nothing, it was all about self-comparing, we used the percentile function and we got the result by which we easily rank the employees based on their performance score. If we used percentage for this example then it could not give such a meaningful result, which can help us to rank the employees. By percentage, we can only know the weightage of each employee’s performance score, which is not comparable to others, but by using a percentile, we can easily compare employees with each other. We don’t have any standard to compare employees we only have a percentile function which helps us to compare them with each other and draw meaningful insight to rank them.
That’s all from how to use the PERCENTILE function in google sheets. I hope you find this article helpful. I will see you soon with another helpful tutorial. Keep learning with Office Demy.


