
To Find Z Score in Google Sheets
- Find the mean of the values.
- Find the Standard deviation of the values.
- Subtract the mean from the data value.
- Divide the resultant value by the Standard deviation.
OR
- Start the Standardize function.
- Give the data value.
- Give the cell reference of Mean.
- Give the cell reference of > St. Deviation.
- Press the Enter key.
In this article, we will learn how to find Z score in Google Sheets. Z-Score is a statistical value used to find the relationship between a data value and the meaning of the dataset. In this article on how to find Z-Score in Google Sheets, we will learn how to find Z-Score in Google Sheets, so you may also interpret your data by using this value. So, here we go.
Why do we use Z Score in Google Sheets?
Z-Score is used to compare a lot of data or huge data sets to find relationships with the mean of the data set; it is measured in terms of standard deviation from the mean. In easy words, with the help of Z-Score, you can calculate the distance from the mean of data set measures using standard deviation.
How to Find Z Score in Google Sheets
The procedure of finding Z-Score in Google Sheets is very easy if you have the average of the values and the standard deviation. If you don’t have one, then don’t worry you can also find average and standard deviations very easily in Google Sheets as well. In this tutorial, we will see all of these things and will also learn two different methods of finding Z-Score.
- Find Z-Score manually by formula
- Find Z-Score by Standardize function
1. Find Z-Score manually by formula
In this method, we will find the Z-Score of the values manually by formula, the formula of the Z-Score is,
Z = (Data Value – Mean) St. Dev
That can be simply applicable if we have the average or mean of the values and standard deviation. Even if you don’t have, you can find average and standard deviation as well in Google Sheets. Let’s see below where we will also see how to find the mean of the values, and standard deviation, and then how to find the Z-Score in the following guide.
Step 1
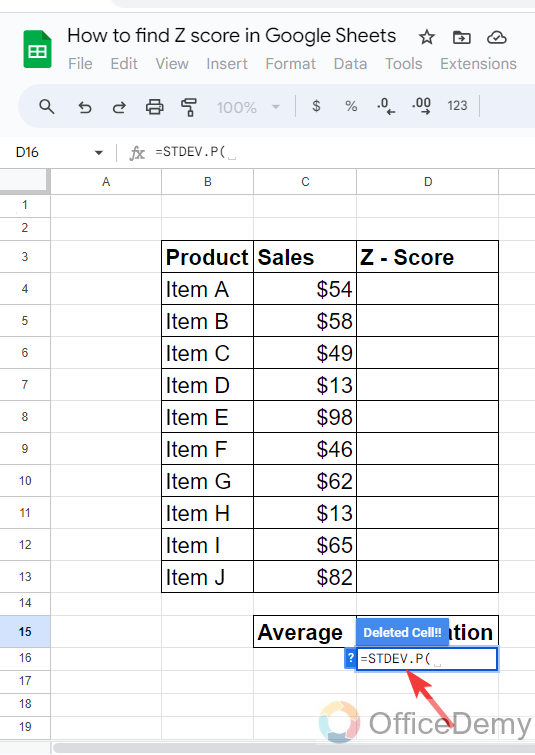
Here, we have sample data of several products with their sales. In the third column, we need to find the Z-Score of the products individually.
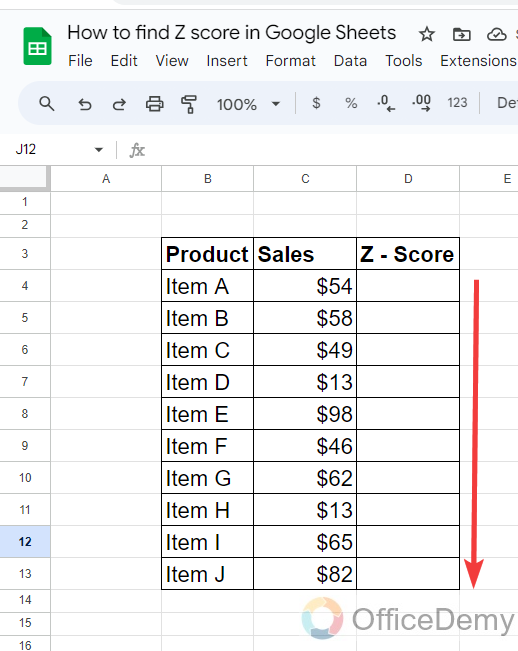
According to the Z-Score formula, we need the Average and standard deviation of the data values, so here first we will find both the average and standard deviation of the values.
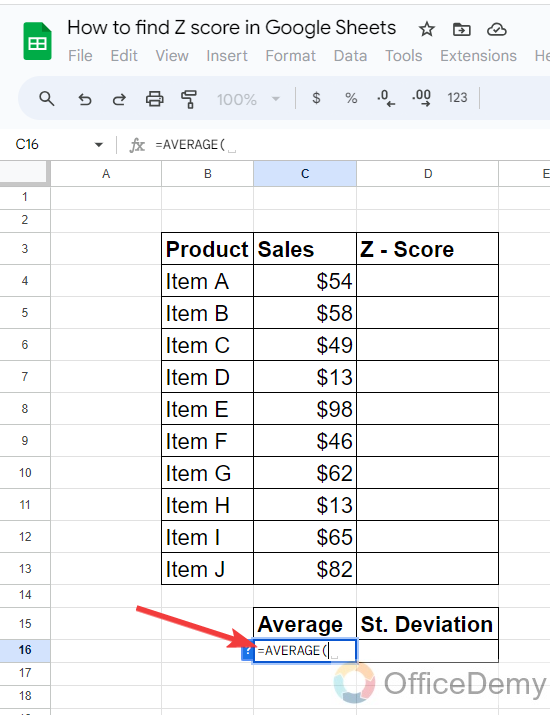
Step 2
To find the average of the values, simply we will use the “Average” function of Google Sheets. To run the function, just Average with an equal sign.
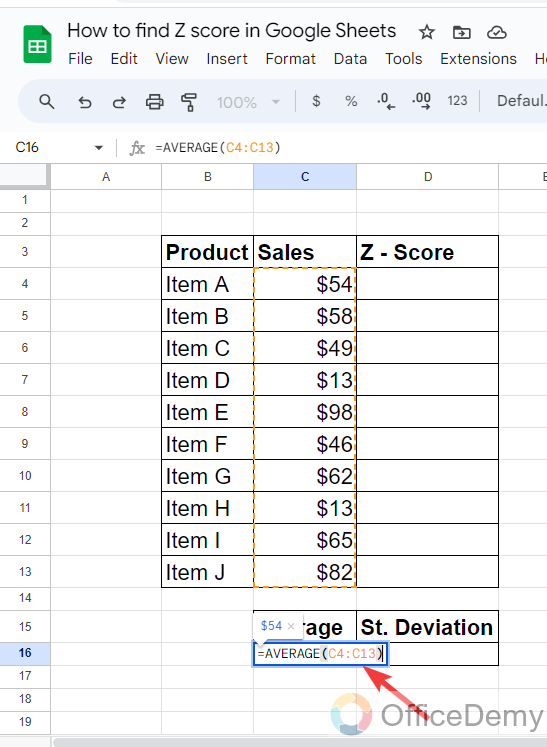
Step 3
After starting the function, give the data range of the values for that you are finding average, as I have given below.
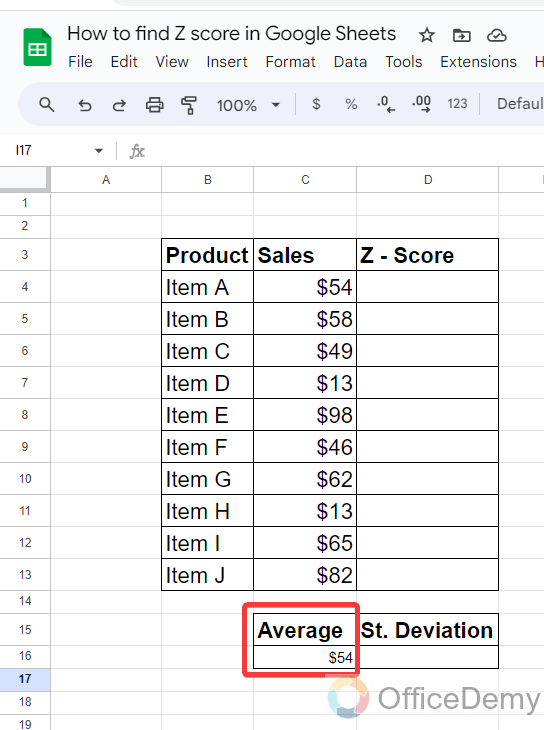
Step 4
There is only a single argument in the Average function, now just press the Enter key to get the result as I have gotten in the following picture.
Step 5
Similarly, to find the standard deviation of the values, we will use the standard deviation function of Google Sheets. To run the function, write “STDEV” with an equal sign.
Step 6
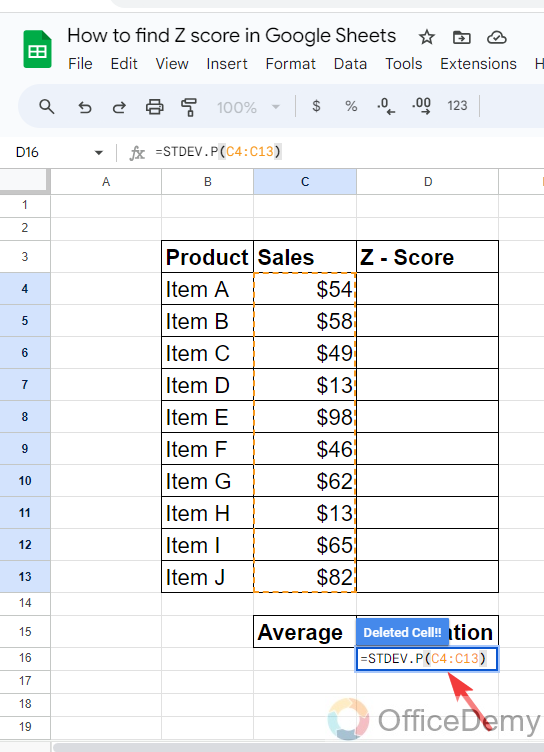
In standard deviation function of Google Sheets also has only a single argument which is the data range that I have provided as follows.
Step 7
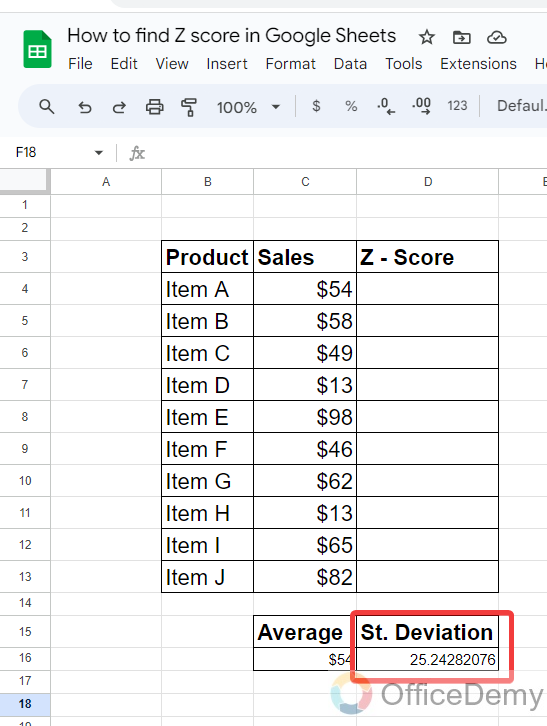
Here, you can see the result in the following picture, you will instantly get the standard deviation of the given values by just pressing the Enter key.
Once you have found both the average and standard deviation of the values, apply the formula of Z-Score in the cell where you want to find the Z-Score of the item.
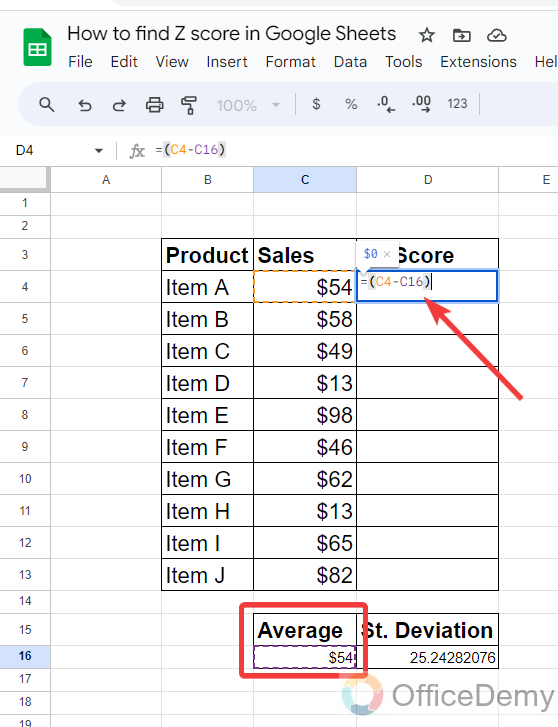
Step 8
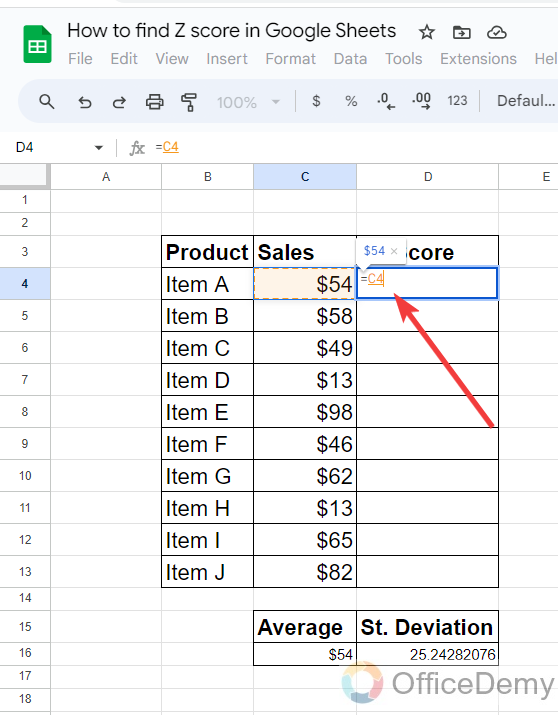
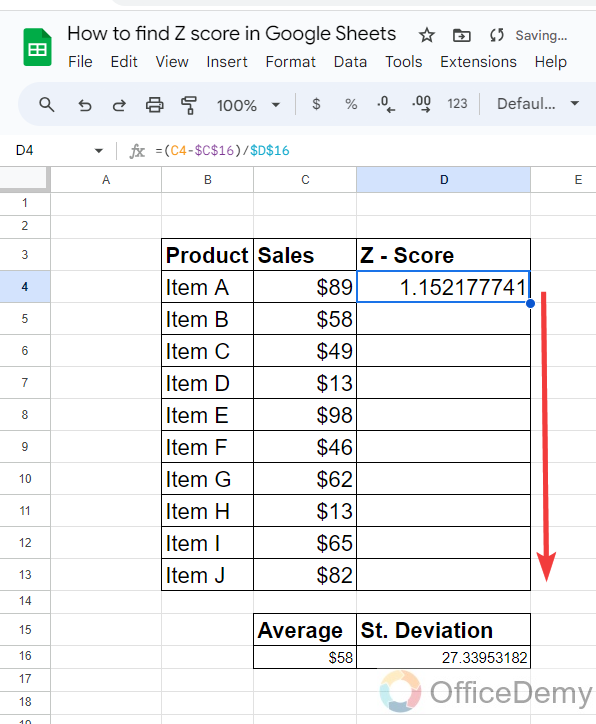
First, we will write an equal sign to start the formula for Z-Score. In the syntax of Z-Score, first, we will give the cell reference of the value for which we are finding the Z-Score.
Step 9
After giving the data value, insert a Subtract sign then give the cell reference of the Average cell. Put this operation into the small bracket to perform the next operation.
Step 10
According to the Z-Score formula, we will have to divide the standard deviation from the resultant value of the subtraction value, so we will write the syntax in the following pattern.
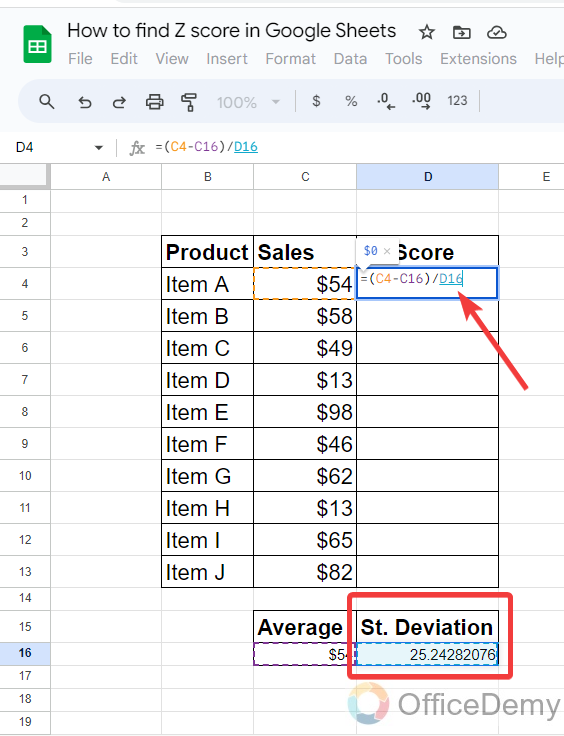
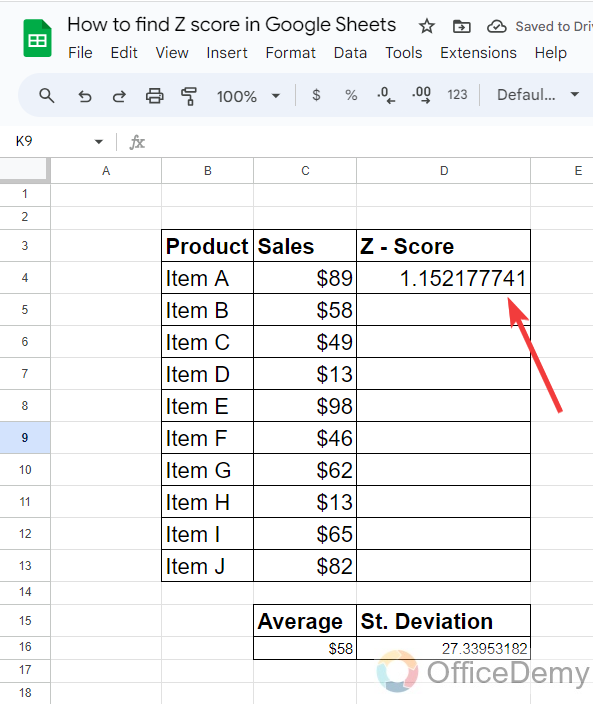
Step 11
You are almost done; you will get your Z-Score for the value as you press the Enter key as highlighted in the following picture.
Step 12
If you want to find the Z-Score for the rest of the values as well then must absolute the cell reference of the average and standard deviation. As they will remain the same for all the values.
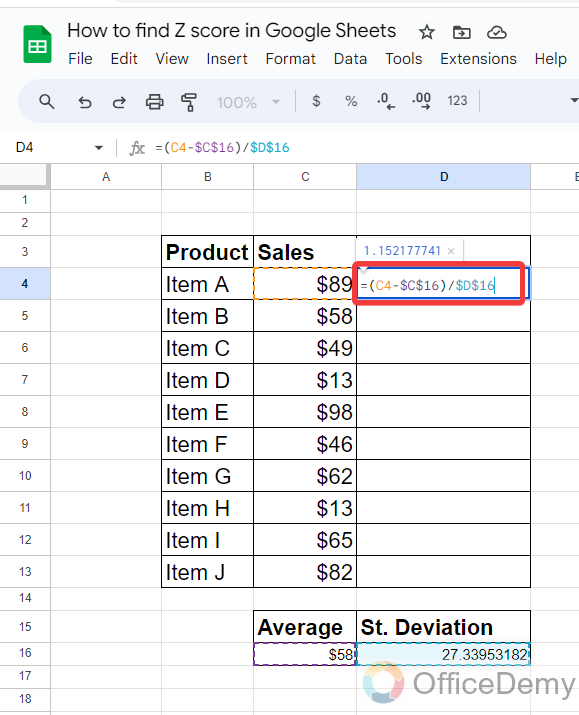
Step 13
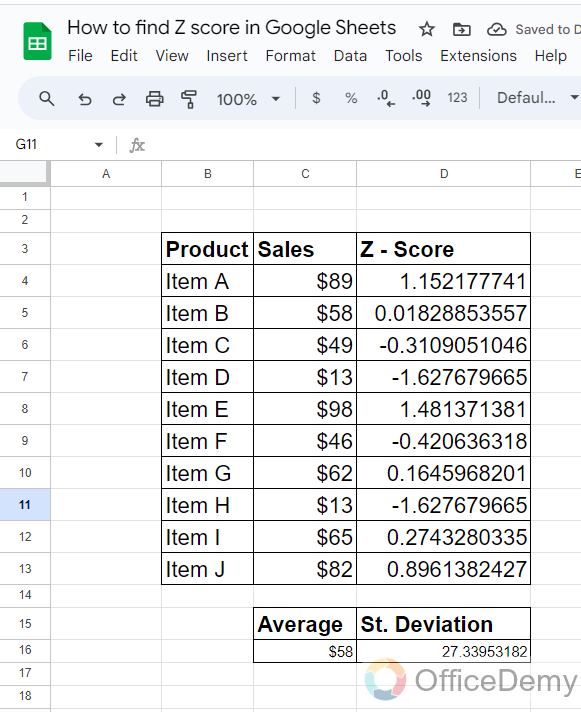
After locking the cell reference of average and standard deviation, now you can drag this formula over the other cells to get the Z-Score of all the values.
Step 14
Here, you can see the result in the following picture, as we have gotten Z-Score for all the values.
2. Find Z-Score by Standardize function
In this method, you don’t need to make subtraction or division, just run the Standardize function of Google Sheets, place the values in the sequence (Data value, mean, St. deviation), and hit the Enter key, you will get the Z-Score of the value. Let me show you practically with a step-by-step guide with the following examples.
Syntax
Z = STANDARDIZE(Data value, Mean, St. Deviation)
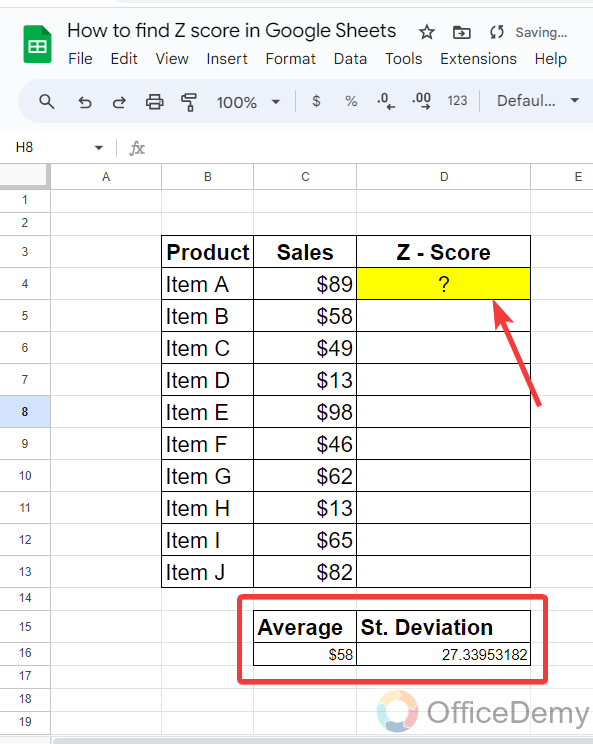
Step 1
If you already have an average and standard deviation for the values now you have to find the Z-Score of the item. You can also find Z-Score with the help of the following method.
Step 2
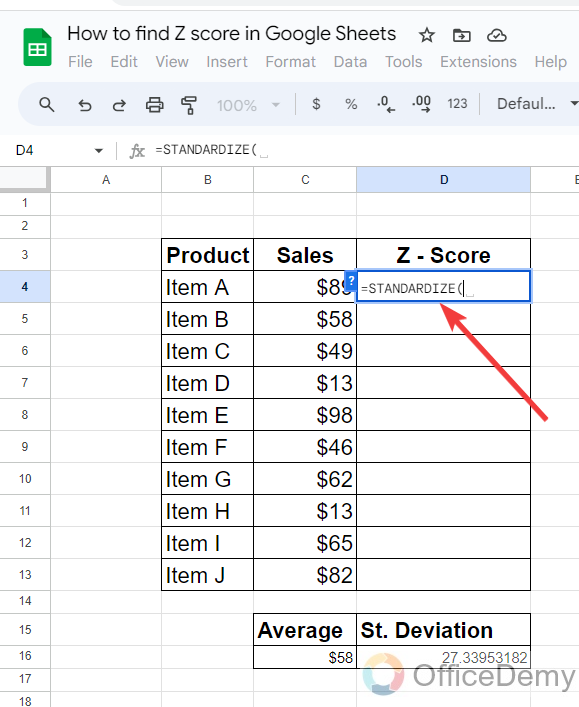
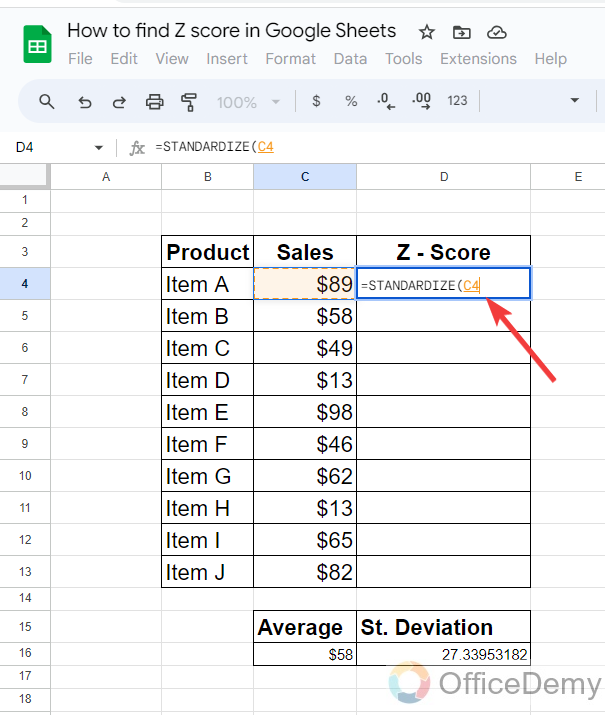
There is a function of Google Sheets, namely “Standardize” through which you can find Z-Score. First, run the function in the desired cell.
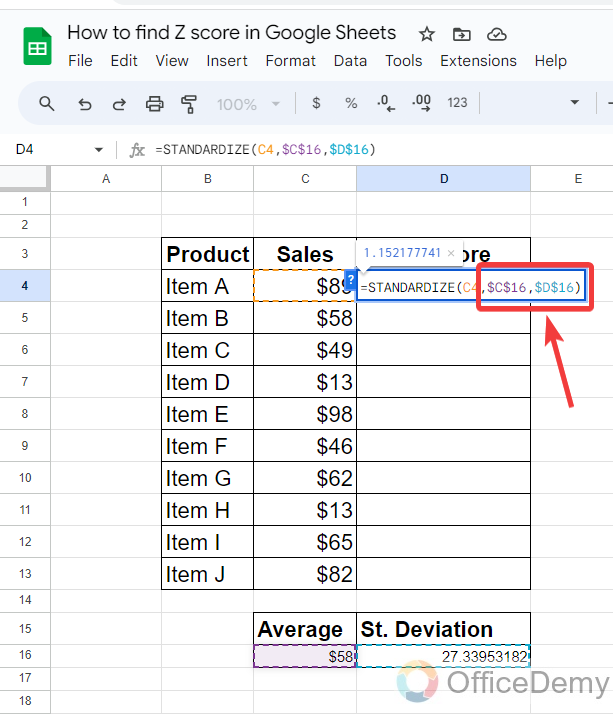
Step 3
After starting the function, first, we will give the cell reference of the value for which we are looking for the Z-Score as I have written in the following picture.
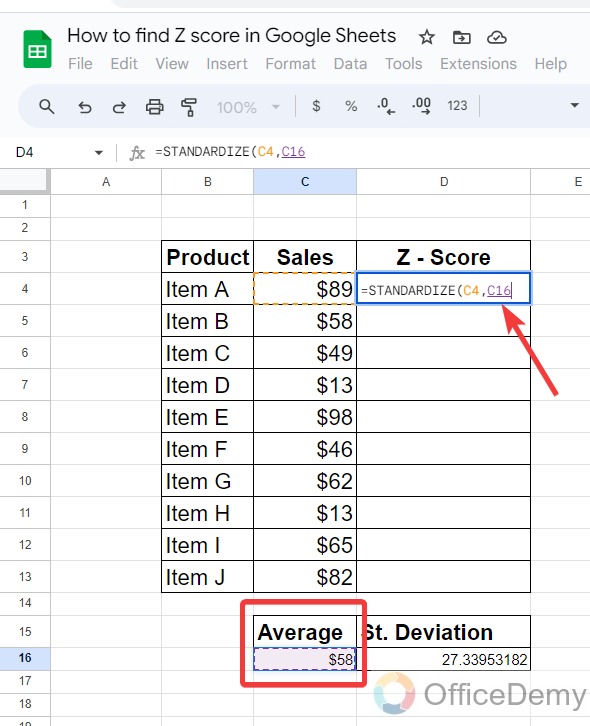
Step 4
After giving the data value, in the next argument give the cell reference of the average value as I have written below in the following picture.
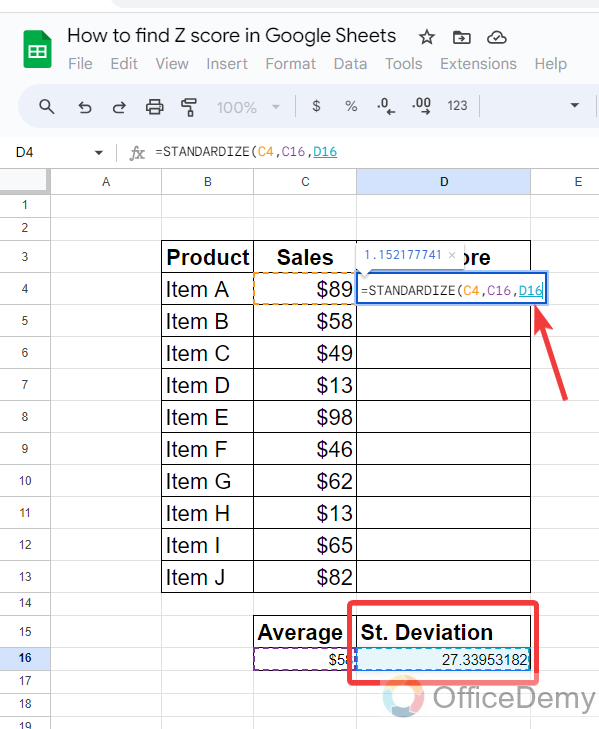
Step 5
After giving the cell reference of average value, in the last argument write the cell reference of the Standard deviation cell in the cell. All these arguments will be separated by a comma symbol.
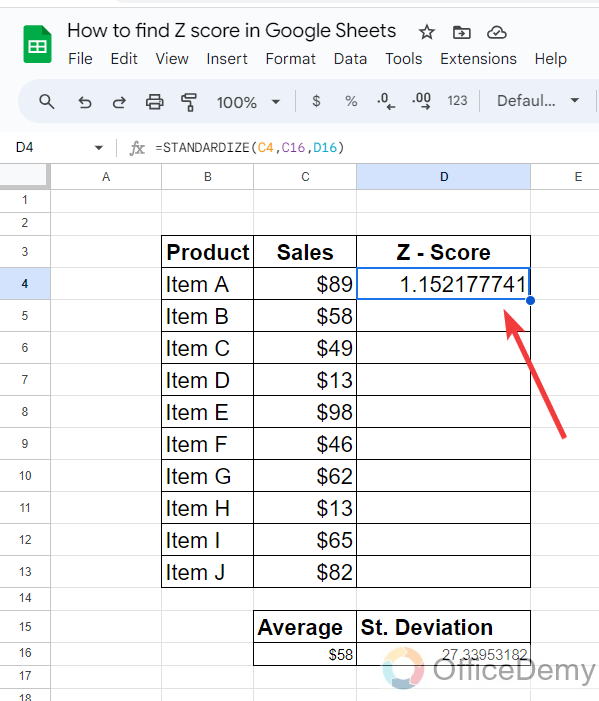
Step 6
You have just one click to go, just press the Enter key and get the result I have gotten in the following picture.
Step 7
Similarly, in this method as well if you want to drag this formula over the other cells to find other Z-Score then first you will have to absolute or pock the cell addresses of the average and standard deviation as highlighted below.
Step 8
Now, you can drag the formula over the other cells, or you can click on the following check sign to Autofill the series.
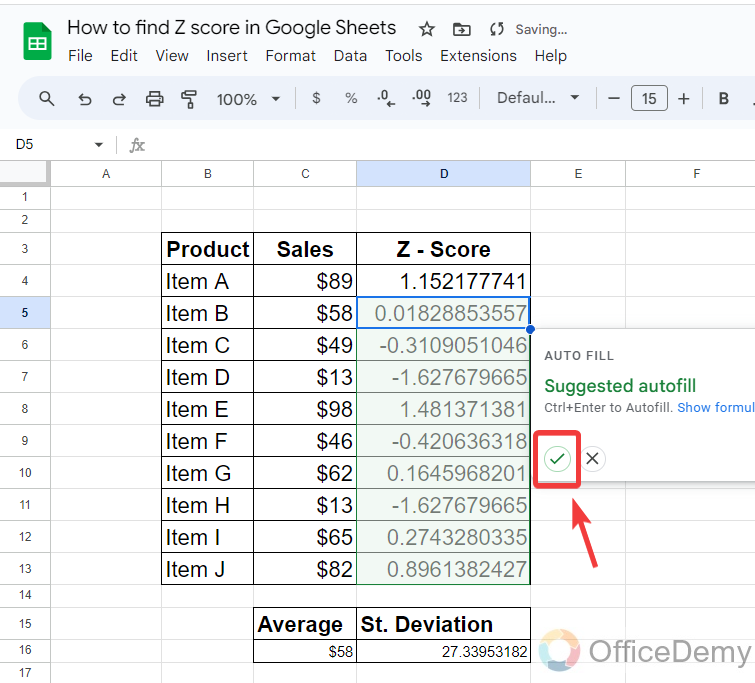
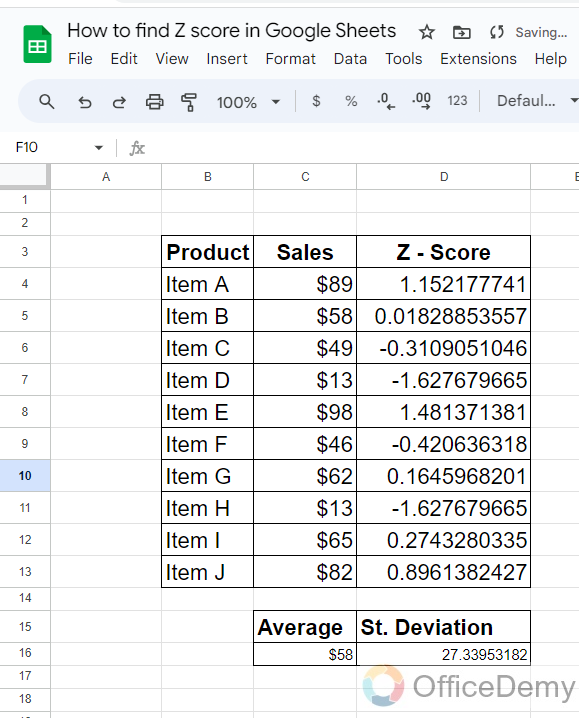
Step 9
You should get the following result by clicking on the Auto-fill option. In this way, you can get the Z-Score of all the values.
Frequently Asked Questions
What is negative Z-Score and positive Z-Score?
A negative Z-Score represents that the observed value is below the mean of total values while the positive Z Score Table represents that the observed value is above the mean of total values.
What is the difference between the Z-Test and Z-Score in Google Sheets?
Z-Test is used to perform a one-sample z-test to determine the probability that a sample mean significantly differs from a population mean. A z-score is a statistical measurement that tells you how far away from the mean your datum lies in a normally distributed sample.
What is the Z-Score for a 90 Confidence Interval?
A Z-Score should be <-1.65 or > +1.65 for approx. 90% confidence level.
Conclusion
Unfortunately, there is no direct function to find Z-Score in Google Sheets, but still, we have covered a couple of methods of finding Z-Score in Google Sheets. Hope this article on how to find Z Score in Google Sheets will be helpful to you to find Z-Score in Google Sheets.


