
To Make a Graph in Microsoft Word
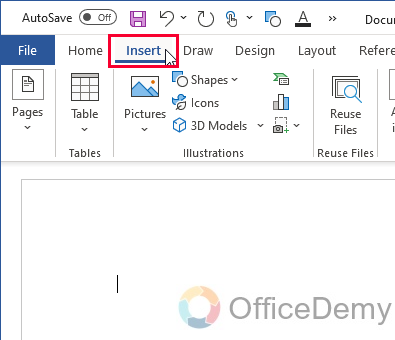
- Go to the “Insert” tab.
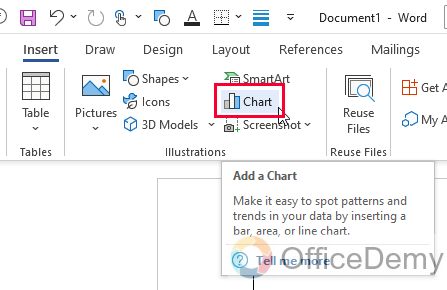
- Click on “Chart” > Select the chart type.
- Manipulate the data by editing the associated Excel file.
- Adjust styles, colors, and chart elements.
Hi guys. Welcome to another tutorial of our Microsoft Word series. Today, we will learn how to make a graph in Microsoft word. We all have seen, created, and interact with graphs, we regularly see them when working on Phones, PCs, or Laptops. They are the most essential type of communication and getting advanced every day with new technology.
Graphs, as we know are an essential tool in visualizing data, making it easier to identify patterns and trends. Microsoft Word offers a simple and effective way to create various types of graphs to present your data clearly and concisely. Whether you need to create a line graph, bar graph, or pie chart, Microsoft Word has built-in tools that make it easy to create professional-looking graphs in just a few simple steps.
In this article, we’ll walk you through the process of creating a graph in Microsoft Word, so you can present your data effectively and efficiently.
Importance of using a Graph in Microsoft Word
In today’s world, data is king. With the increasing availability of data, it has become crucial to present it in a way that is easily understandable for your audience. That’s where graphs come in handy. Graphs help you to represent your data in a visual format, making it easy to interpret and understand. Whether you are a student presenting a project, a professional presenting a report to your team, or a researcher presenting your findings, graphs play a crucial role in conveying information.
Microsoft Word is one of the most widely used software applications, and it comes equipped with powerful tools to help you create professional-looking graphs. By learning how to make a graph in Microsoft Word, you can easily create a visual representation of your data and present it in a way that is both clear and concise.
Also, making graphs in Microsoft Word has several advantages. For one, it allows you to save time and effort as you don’t need to switch between different software applications. It also enables you to make quick edits to your graph without having to start from scratch, saving you a lot of time and effort.
So we can say, Microsoft Word is an accessible tool that is available to most people, making it a convenient way to create graphs quickly and easily.
How to Make a Graph in Microsoft Word?
This method will clear all your doubts and confusions about charts, I have seen some learners get afraid of charts and they try to keep themselves away from them but trust me they are built to help you deliver your message more precisely and the viewer to perceive this message more effectively and quickly. So, today you are going to learn how to make a graph in Microsoft word with all its instances and features.
Make a Graph in Microsoft Word – Graph Creation
In this section, we will learn how to make a graph in Microsoft Word from scratch. This method is the first method when you are going to make charts. So, the main thing here is to understand how to start a chart and then you can always customize them and change data for them.
Step 1
Open Microsoft Word and select the “Insert” tab from the top menu.
Step 2
Click on “Chart” from the “Illustrations” group
Step 3
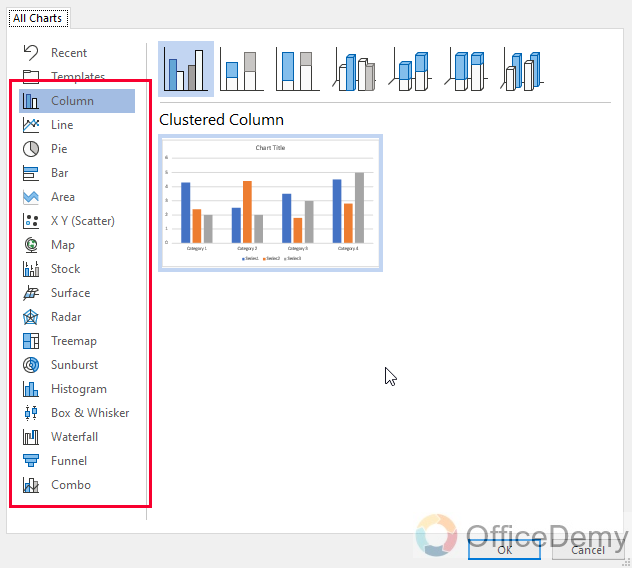
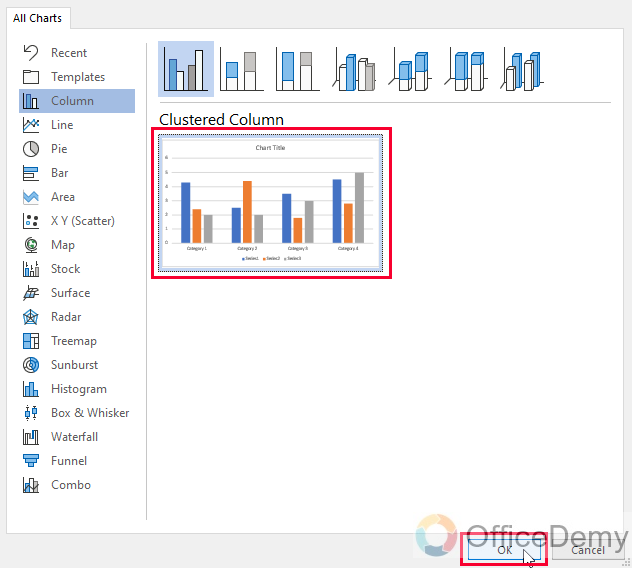
Select the type of chart you want to create from the “Insert Chart” window that appears.
Step 4
As you click on the Ok button, it will be created instantly, and an associated spreadsheet will also appear that holes the dummy data
Step 5
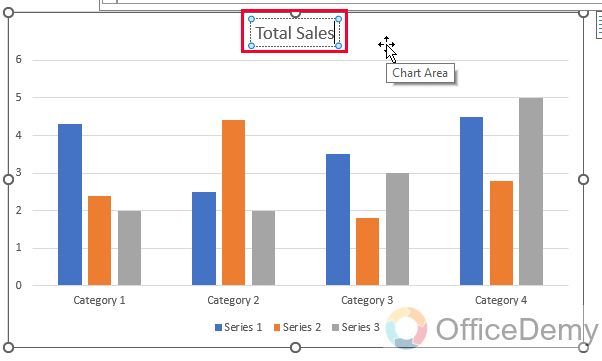
You can customize the chart by changing the chart title, axis titles, and other elements to suit your needs.
Step 6
You can also adjust the size and position of the chart by clicking and dragging it to the desired location.
So, this is the basic introduction to how to make a graph in Microsoft word.
Make a Graph in Microsoft Word – Data Manipulation
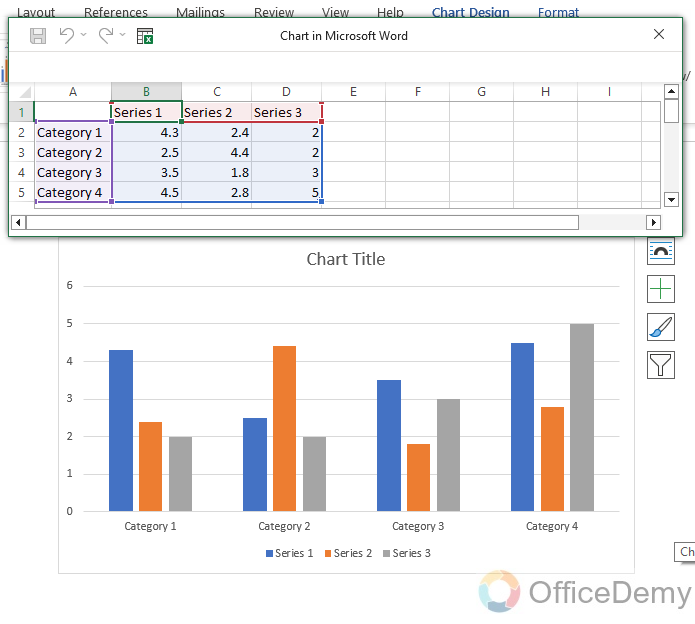
In this section, we will see the excel file that comes across when we create a new chart, this is a temporary and automatically created excel sheet that holds some dummy data that makes the chart for us. We can change it to change our chart needless to say but it’s the data that is only holding some random values that are important to show something on the chart nothing more.
Step 1
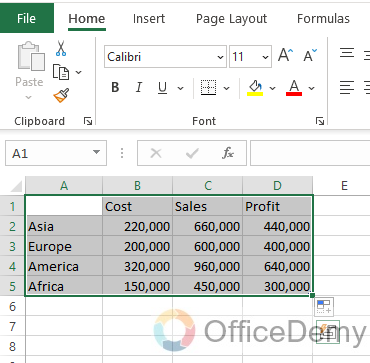
Go to the excel file opened over your document and make changes to the data
Step 2
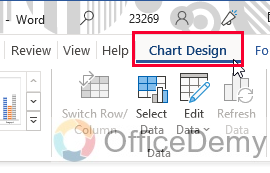
If you have closed the excel file mistakenly, then click on the Chart Design tab
Step 3
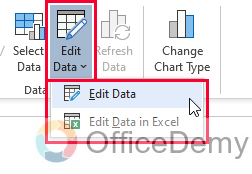
Now click on the Edit data dropdown and select “Edit data” to edit it here or “Edit data on Excel” to open the excel file separately for editing
Step 4
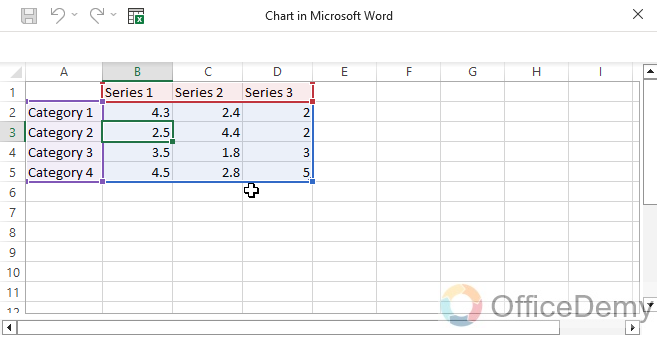
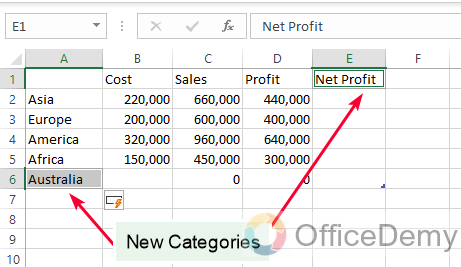
In the Excel file, you can change the Category name to your categories such as Region names from which your sales are coming to analyze how much sales are coming from each region
Step 5
You can also add/remove categories for each Series as per your data requirements.
Step 6
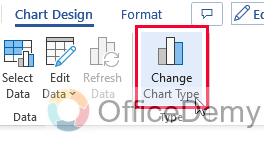
If you want to change the chart style at any point you can do that by going to the “Chart Design” Tab, and then “Change chart type”
So this was all about how to manipulate your data for the charts in Microsoft Word.
Make a Graph in Microsoft Word – Graph Customization
In this section, we will see how to make a graph in Microsoft word and then how to customize or design that graph using the pre-built options of Microsoft word. So, let’s see the quick designing guide for graphs in the below steps.
Step 1
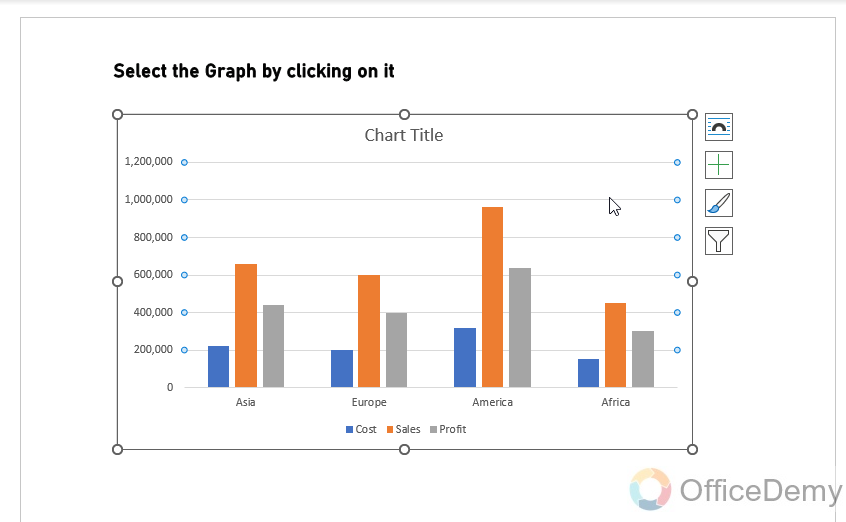
After creating your graph, click on it to select it.
Step 2
In the “Chart Design” tab, click on the “Chart Styles” drop-down menu to choose from a range of preset styles for your Graph.
Tip: You can hover your mouse over each option to preview the changes it will make to your chart.
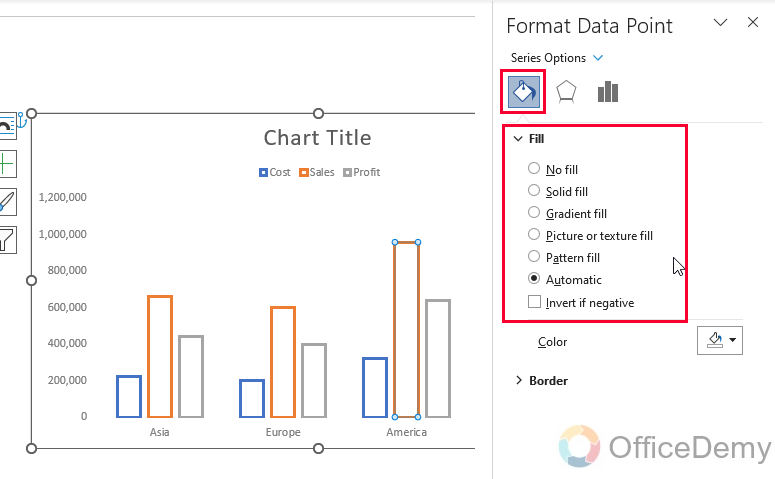
Step 3
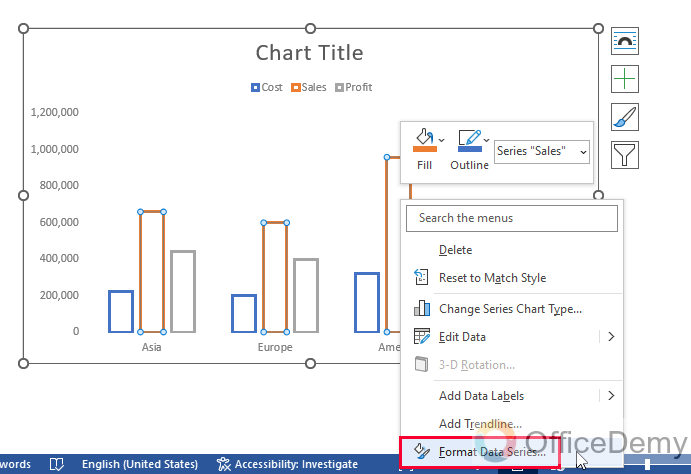
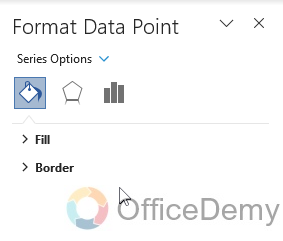
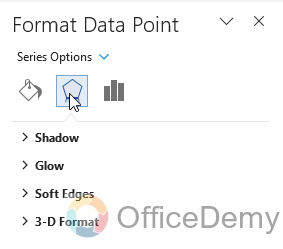
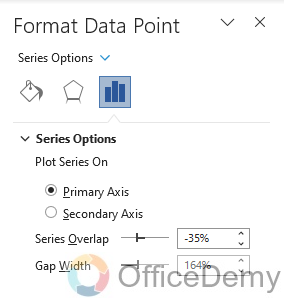
To customize individual elements of your chart, click on the element you want to change. For example, to change the color of the bars in a bar chart, click on one of the bars to select the entire data series, then right-click and choose “Format Data Series“. From there, you can change the fill color, outline color, and other options to your liking.
Step 4
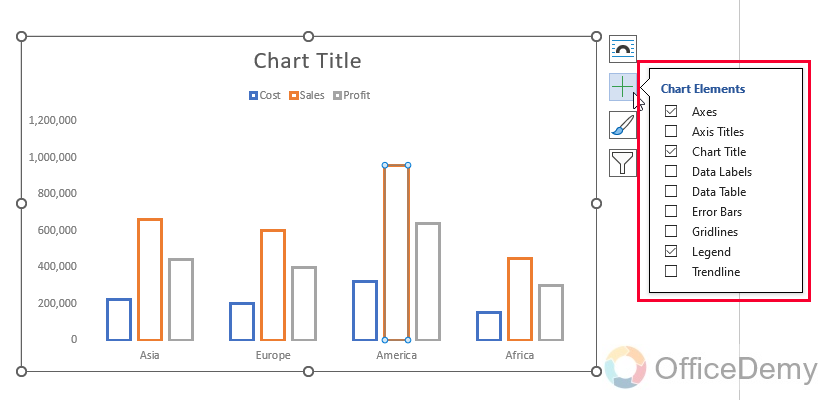
Click on the Plus icon associated with your chart to use “Chart Elements” then a list of elements and a checkbox with them, check the elements you want to have with this chart and left all others unchecked.
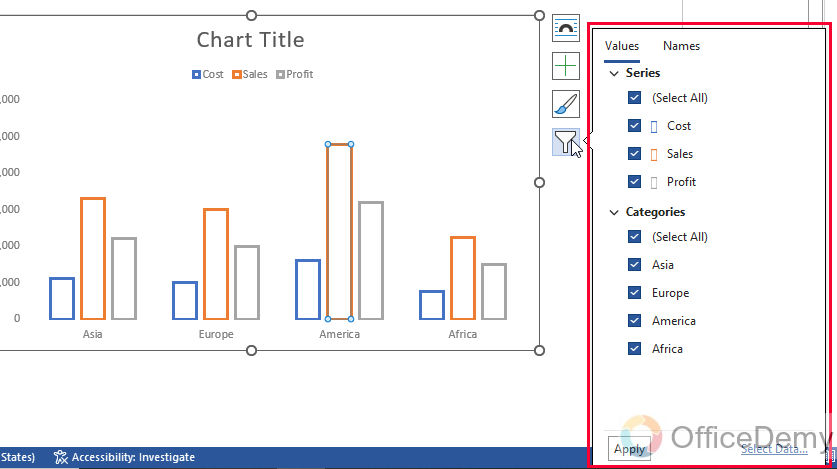
Step 5
Use the “Chart Filters” button to fill out specific data points or series from your graph. This can be helpful if you have a lot of data and want to focus on specific aspects of it.
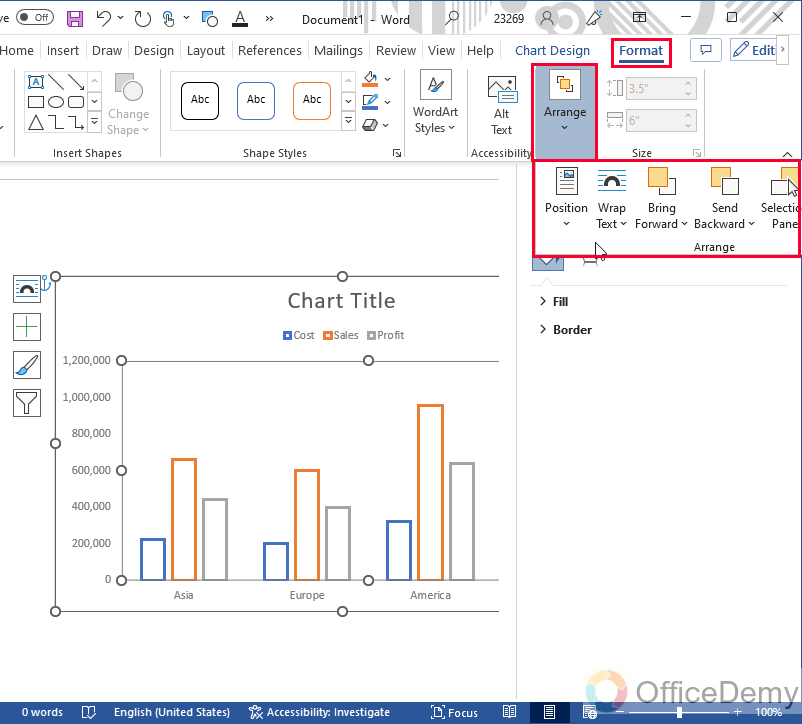
Step 6
Adjust the size and position of your graph by clicking and dragging it to the desired location, or by using the options in the “Size” and “Position” groups on the “Format” tab.
Step 7
You can change the colors of your graph, even for specific elements, click on the element, and you will have the option of color changing and many others in the right-hand sidebar.
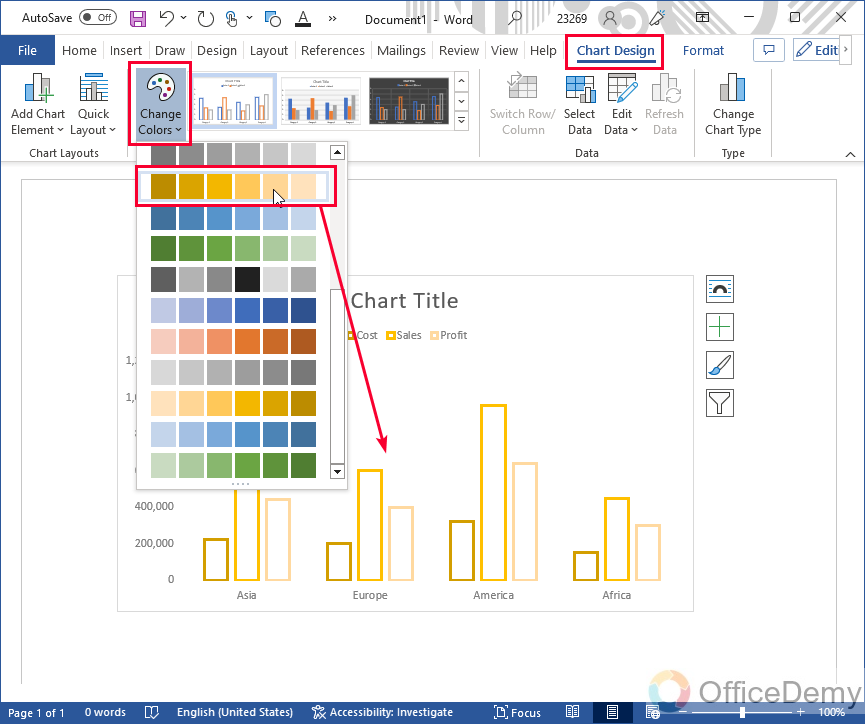
Step 8
To change the overall color theme of your graph, go to the “Chart Design” tab in the main menu, then click on the “Change Colors” dropdown button, and select from so many colors palettes
So, this is the most out of your graph customization, and I hope now you have learned how to make a graph in Microsoft word.
Frequently Asked Questions
Can I Use the Same Method to Make a Chart and a Graph in Microsoft Word?
Yes, you can use the same method for pie chart creation in word as you would for creating a graph. Microsoft Word offers various tools and features to help you design and customize charts and graphs, including pie charts. Simply follow the steps for graph creation and select the pie chart option to create visually appealing and data-driven pie charts in Word.
Conclusion
This was all about how to make a graph in Microsoft Word. I am hoping that you enjoyed this guide as well. I will see you soon with some more learning material till then take care. Keep learning with Office Demy.


