
To Create a Venn Diagram in Google Docs
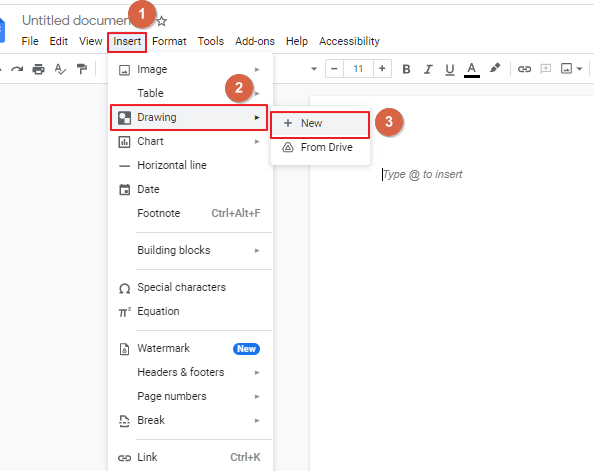
- Go to “Insert” > “Drawing” > “New“.
- Use the Drawing tool to create ovals for your Venn diagram.
- Customize oval colors and transparency.
- Add text to the ovals.
- Adjust the sizes and show similarities and differences.
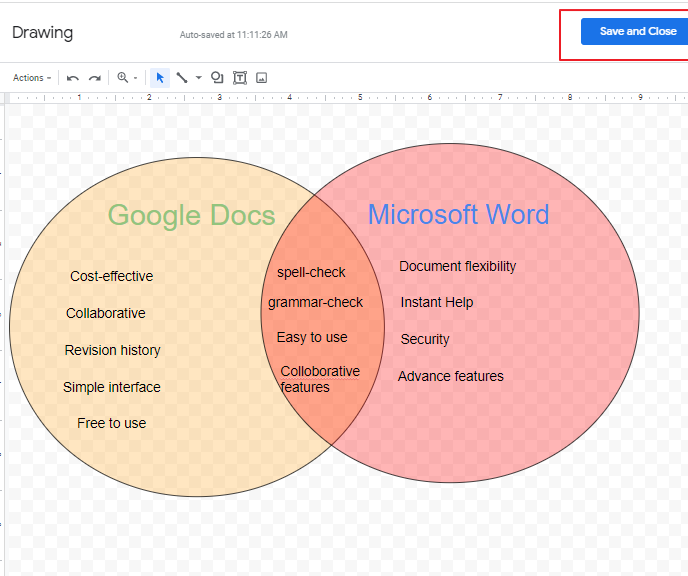
- Click “Save and Close” to add to your document.
OR
- Go to “Add-ons” > “Get Add-ons“.
- Install the “Lucidchart diagrams” app.
- Use the app to create a Venn diagram.
- The diagram will be added to your Google Docs document.
In this article we will learn about how to create a professional looking venn diagram in google docs using two different methods.
Google docs must be the only online tool to provide a built-in drawing tool. It allows users to collaborate and work in real-time to create images, flowcharts, graphics, charts, and other educational diagrams. One of the benefits of the google docs drawing tool is that it helps explore the concepts and educate the students vividly. Self-explanatory illustrations help understand the subject more precisely rather than traditional methods.
With the Google docs drawing tool, students perceive the concept and can break through complex structures easily. Aside from the built-in drawing tool, Google docs also provide third-party add-ons to create and execute the notion. These add-ons are easy to install and use. Learning through drawings must help sort the information and provide the solution effortlessly.
If you are interested to learn about how to indent the second line of your paragraph in google docs, please follow the link below.
How to Indent the Second Line in Google Docs (2 Methods)
Advantage of using Venn diagram in Google Docs
Venn diagrams are called set theory or logic theory used in mathematics, statistics, computer science, linguistics, and business. They are simple diagrams that help understand the relationship between two items within a particular component. These are used in presentations and reports as it depicts data.
- Helps in decision-making
- The visual organization of data and information
- Solves complex situations
- Reason through logic
Google Docs allows you to create a Venn diagram using the Drawing tool. Adding text in Venn diagrams is difficult with the space provided. Therefore, Google drawings help you to create diagrams of any size.
How to Create Venn Diagrams in Google Docs
This method describes creating Venn diagrams using Google docs’ built-in drawing tool.
Step 1:
Open Google docs. Go to Insert -> Drawing -> New.
Step 2:
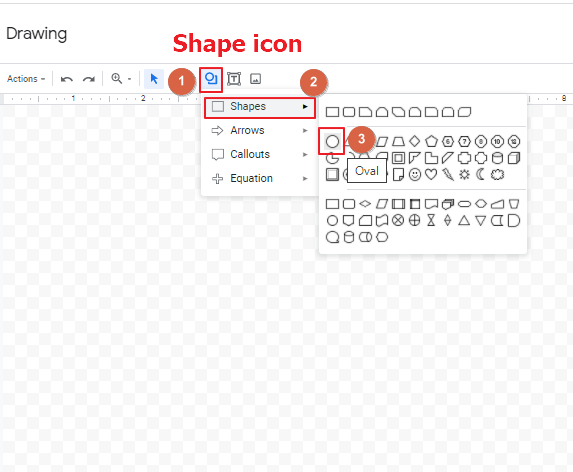
The Drawing window opens. Click the Shape icon in the toolbar and select the oval shape from the Shape option.
Step 3:
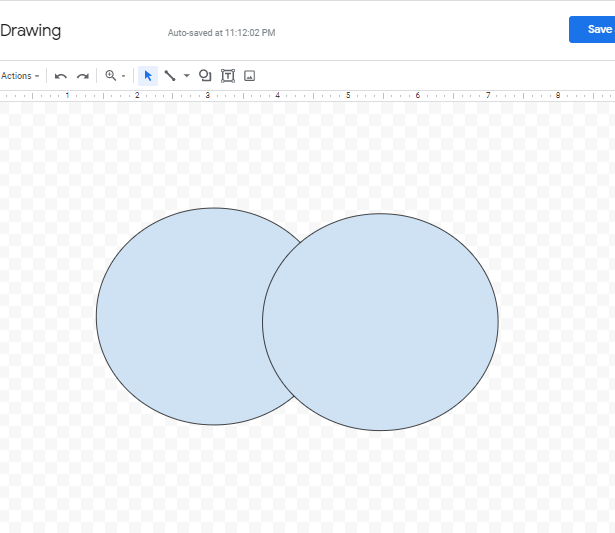
Draw the shape in the drawing panel. Select the oval and press Ctrl+C and then Ctrl+V to copy and paste to draw another oval.
Step 4:
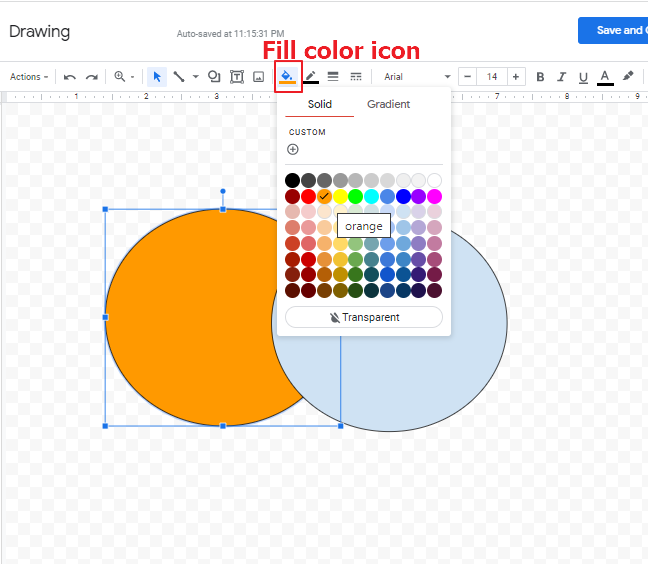
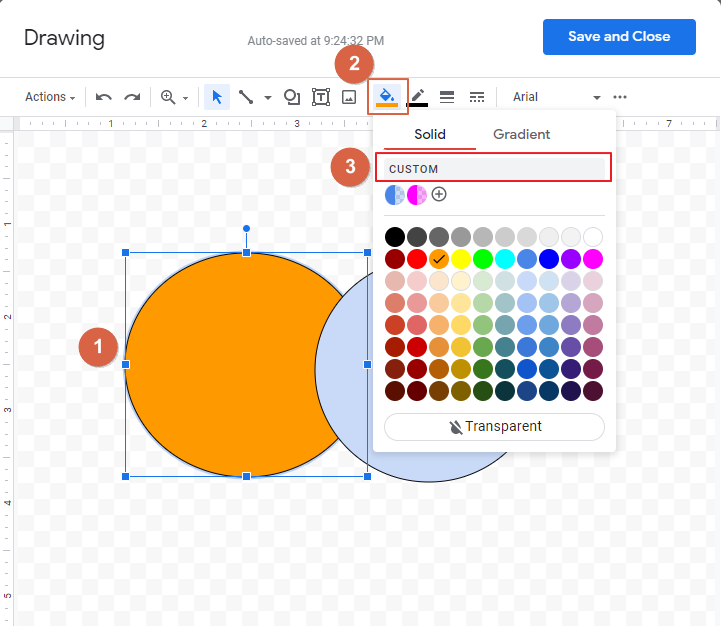
Select the oval and the required color from the Fill color icon to change the fill color of the shapes
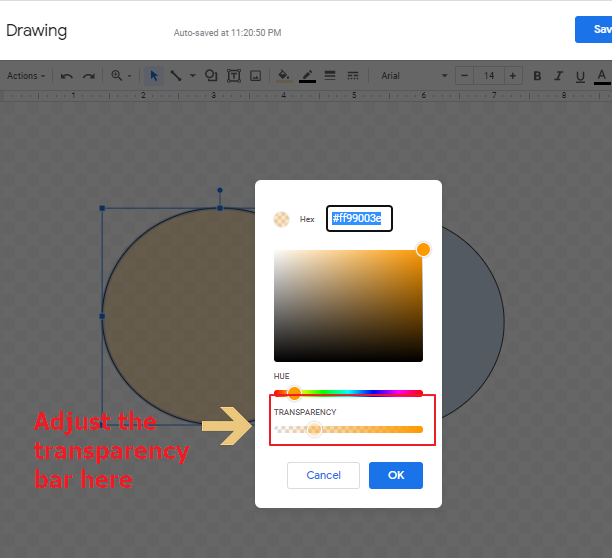
Step 5:
Select Custom in the Solid tab of the Fill Color panel to adjust the transparency of the color. In the customize color panel, change the transparency bar to lighter version and click ok.
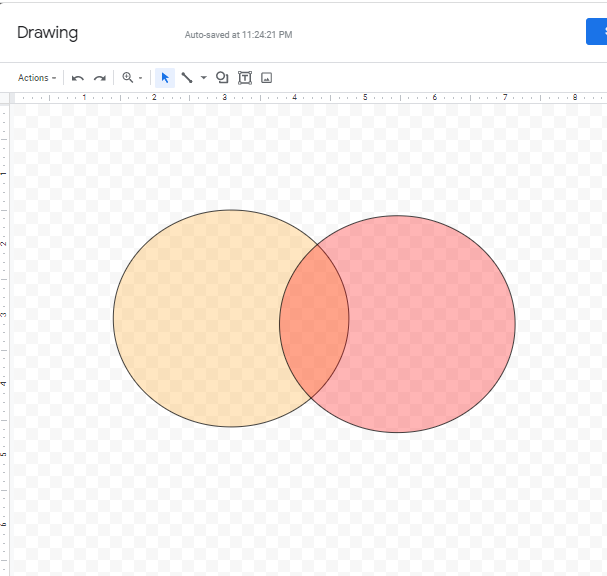
Step 6:
Change the color and adjust the transparency of the second circle in the similar process.
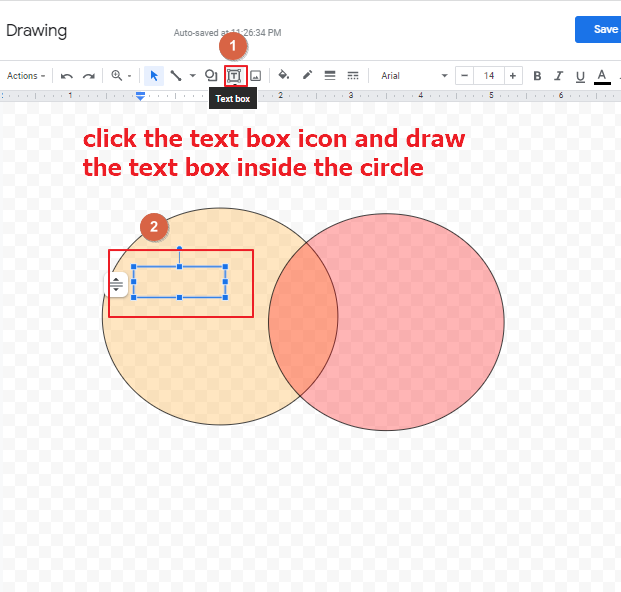
Step 7:
Select the shape and click text box icon to add text to the circles. Draw a text box inside the circle and add the required text.
Step 8:
Click the shape and drag the anchor pointer on the sides of the circle to enlarge the size of the circle.
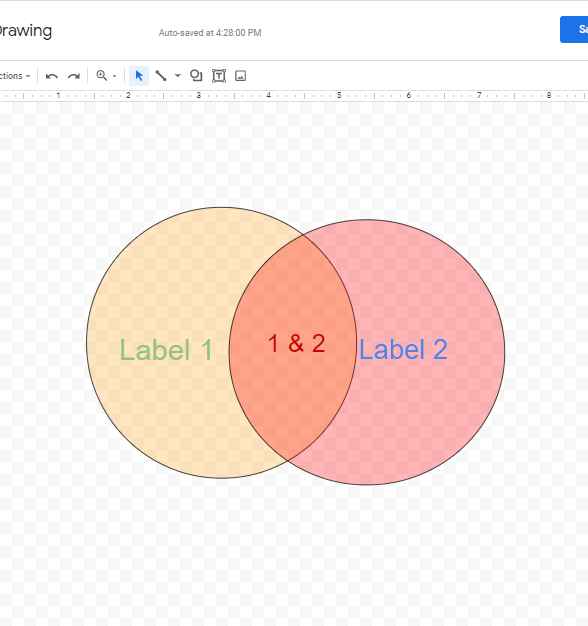
Step 9:
You can demonstrate the similarities in the intersection and differences in the outer section of the circles as shown in the figure below. Click Save and Close to save and add the Venn diagram to the Google doc screen.

How to Create Venn Diagram using Third-party Add-ons
Step 1:
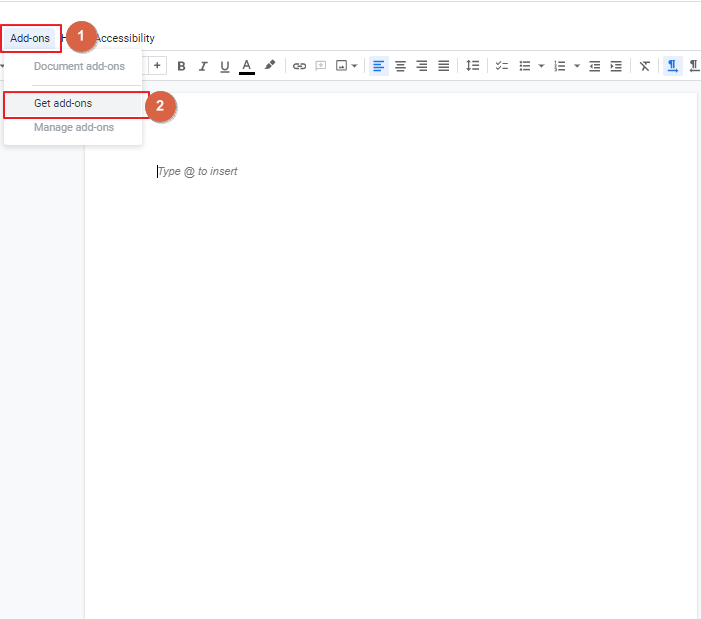
Open Google Docs. Go to Add-ons -> Get Add-ons.
Step 2:
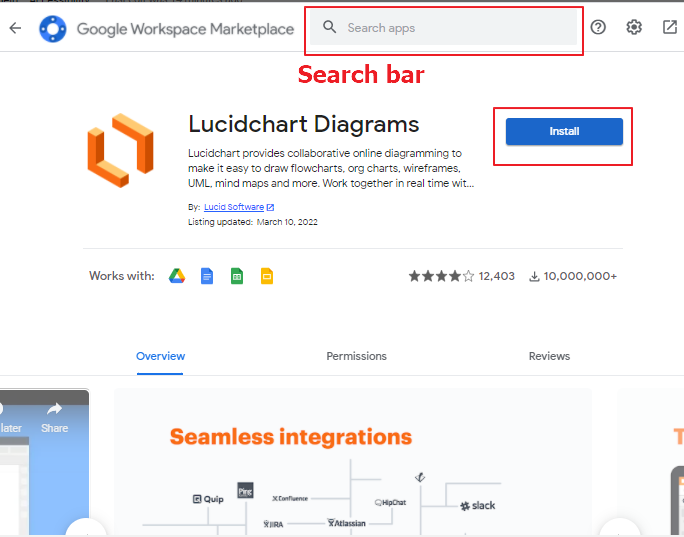
The Google Workspace Marketplace window opens. Search Lucidchart diagrams add-on in the Search bar. Select the app and click Install.
Step 3:
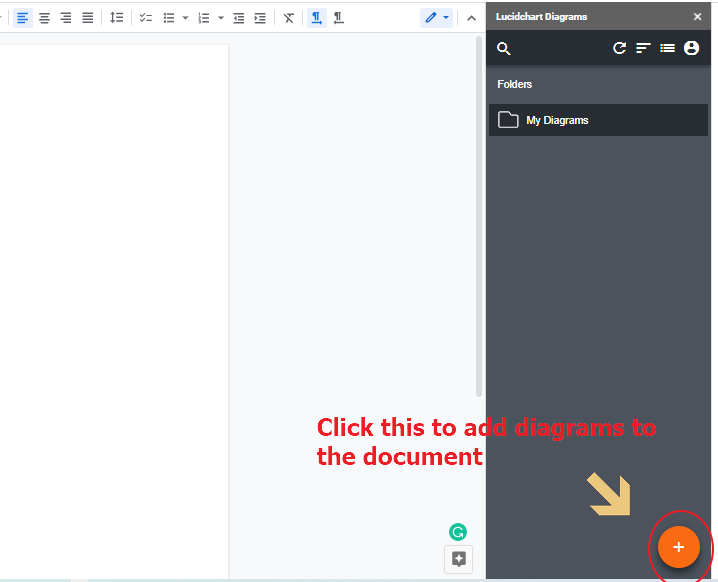
The Lucidchart Diagram tool bar appears on the right-side corner of the screen. Click the plus sign in the bottom corner of the tool bar to add a diagram.
Step 4:
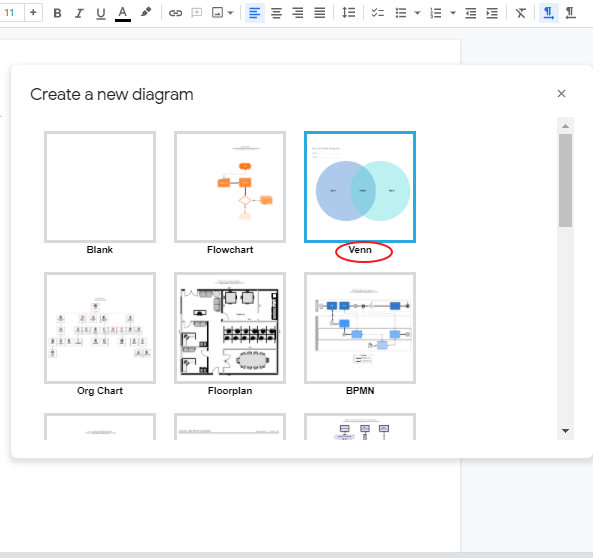
Select Venn from the list of diagrams in the Create a new diagram window.
Step 5:
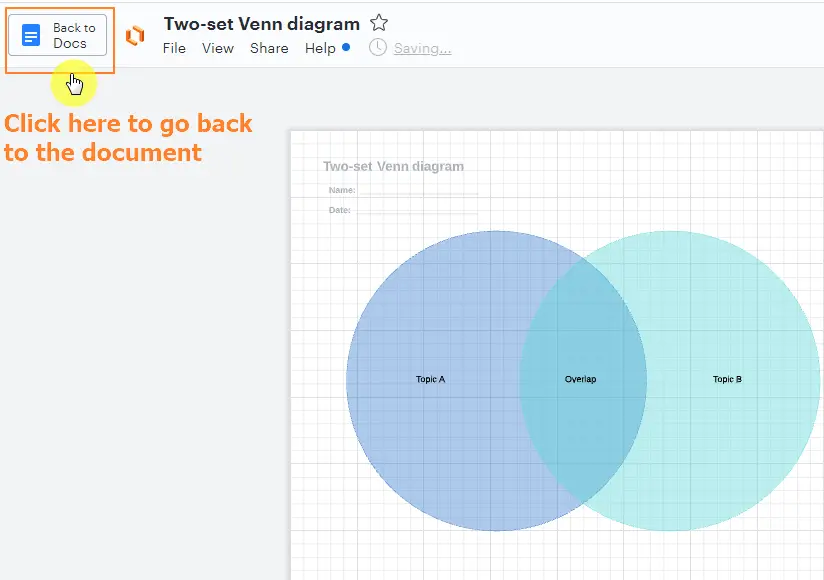
Lucidchart diagram opens the Venn diagram in a separate screen. Click Back to Docs to return to the google doc.
Step 6:
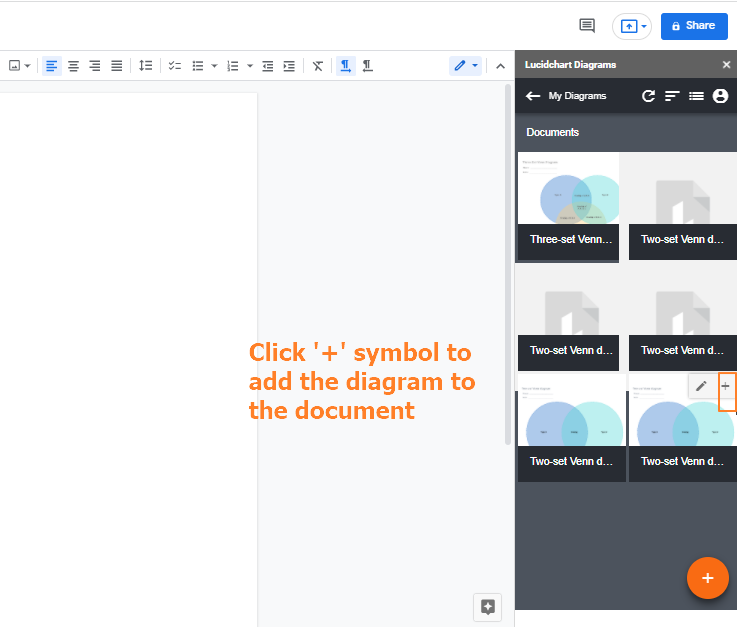
The Venn diagram is added to My Diagram folder in Lucidchart Diagrams tool bar. Click the ‘+’ symbol in the top corner of the diagram to add it to the google doc screen.
Step 7:
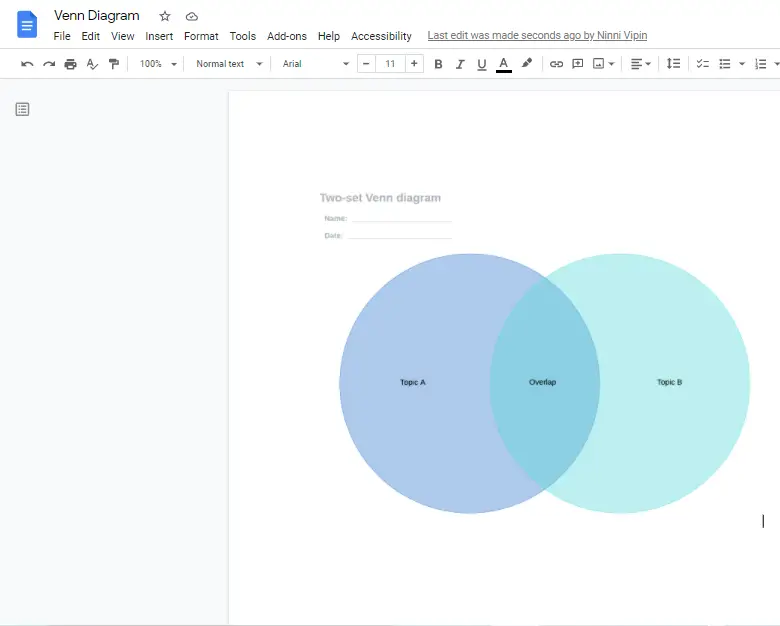
The Venn diagram is added to the Google doc screen.
- You can create more than two-set of Venn diagrams using both the Drawing tool and Lucidchart Diagram add-on
- Once added to the document, the Venn diagram is considered an image. You can alter the Image options such as text wrapping and image rotation for the image
- Lucidchart Diagram allows you to convert the diagrams into a template
Video Tutorial: How to Create a Venn Diagram in Google Docs
Notes
- You must upgrade your account to the premium to edit the Venn diagram in Lucidchart Diagram
- Make sure to enlarge the shape of the circle to add more information to the Venn diagram
Conclusion
Google Docs’ built-in Drawing feature is one of the most comprehensive tools that allow users to create graphics, charts, and more images without amending the picture quality. It is resourceful for changes done in the nick of time. Google doc has leverage when compared to other tools. The collaborative feature where you can share images, charts, and graphs and edit real-time with other users is a boon. This article focuses only on creating Venn diagrams in Google Docs and you can design significantly more.


