
To Create a Leaderboard in Google Data Studio
- Set up a Google Sheets file with columns for names, teams, points, ranks, and image URLs.
- In Google Data Studio, create a blank report and connect it to the Google Sheets file.
- Set data types for fields, including changing “Player/Image” to URL.
- Create a table chart in Data Studio to visualize the leaderboard.
- Customize the leaderboard’s appearance with conditional formatting, fonts, and cell alignment.
Hi. In this article, we will learn how to create a leaderboard in Google Data Studio. We have been learning so many concepts and frameworks for data analytics, and data visualization, we recently learned how to create a funnel in Google Sheets, how to make a dashboard, and how to make brochures in Docs. So, this is another framework learning tutorial in which we are going to create a leaderboard in Google Data Studio with the help of a custom Google Sheets file with the leaderboard data. So, this article is going to be in two sections.
In the first section, we will learn how to set up a Google Sheets file with all the required data for creating a leaderboard, and then we will use Google Data Studio to visualize the leaderboard and will see some excellent customization features for it. So, let’s get started.
Importance of Creating a Leaderboard in Google Data Studio
Leaderboards are popular for visualizing rankings data. If you watch sports, you must have seen the top 10 cricketers of the month list. Even if you follow any online sports, you see leaderboards in which the top 10 or top 20 players are listed with their positions and images. This is what we called a leaderboard, It’s nothing but a listing table in ascending order.
We can create a simple leaderboard in Google Data Studio, but the most important thing is the image, to add an image to Google Data Studio, we need to add a custom field and make an image function to show images. We cannot directly visualize images from any data sources even if the images are uploaded in that file.
We can create leaderboards using normal tables in Google Data Studio, or we can use custom tables from the community visualization that gives us more control and power over the customization and editing of the tables. So, I am going to use a simple table so that everyone can follow this tutorial. So, these are reasons, why leaderboards are made, and why do we need to learn how to create a leaderboard in Google Data Studio?
How to Create a Leaderboard in Google Data Studio?
From this section, we will start implementing the methods and procedures we need to create a fully customized leaderboard in Google Data Studio. We are not going to use any premade template, any sourced data, or any chart builder externally. We will solely use Google Sheets and Google Data Studio to create a leaderboard in Google Data Studio. So, let’s start with the Sheets file
Set up a Google Sheets File with the Leaderboard’s Data
In this first section, we will learn how to create a leaderboard in Google Data Studio, and how to set up a Google Sheets file with the leaderboards data. So, I have a blank Google Sheets file, in which I will add 10 random people images (from copyright-free images), and I will add their dummy names and their team names, then I will give them some points, and based on that I will give them positions from 1 to 10, and lastly, I will add up their images as a URL. Now, let’s practically learn how to do that.
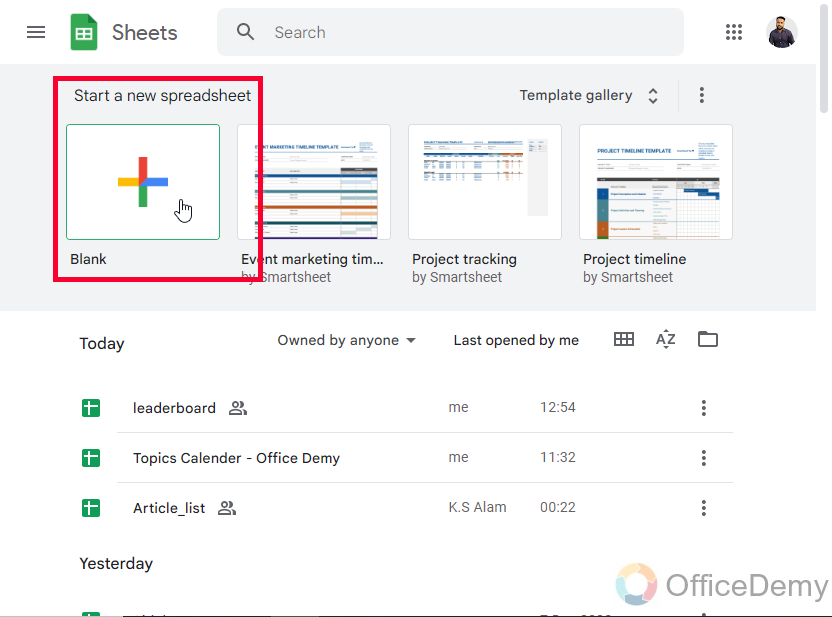
Step 1
Open a blank Google Sheets file
Step 2
Add headings in the first-row columns
You can use headings, such as below:
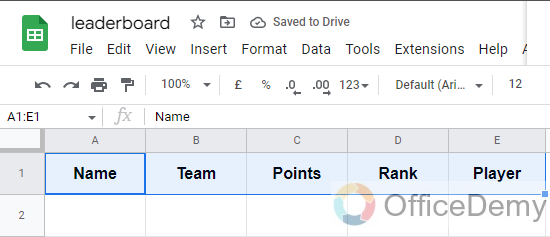
- Name: Contains the player’s name (data type: text)
- Team: The team’s name (data type: text)
- Points: Number of points this player has (data type: number)
- Rank: The rank of the player from 1-10 (data type: number)
- Player/Image: The image of the player as a URL (data type: URL)
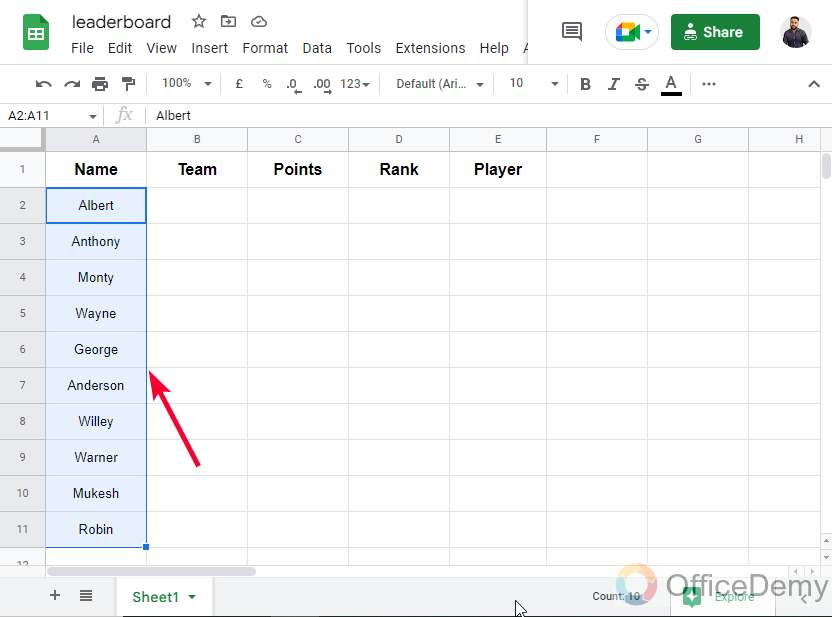
Step 3
Add random names for the players
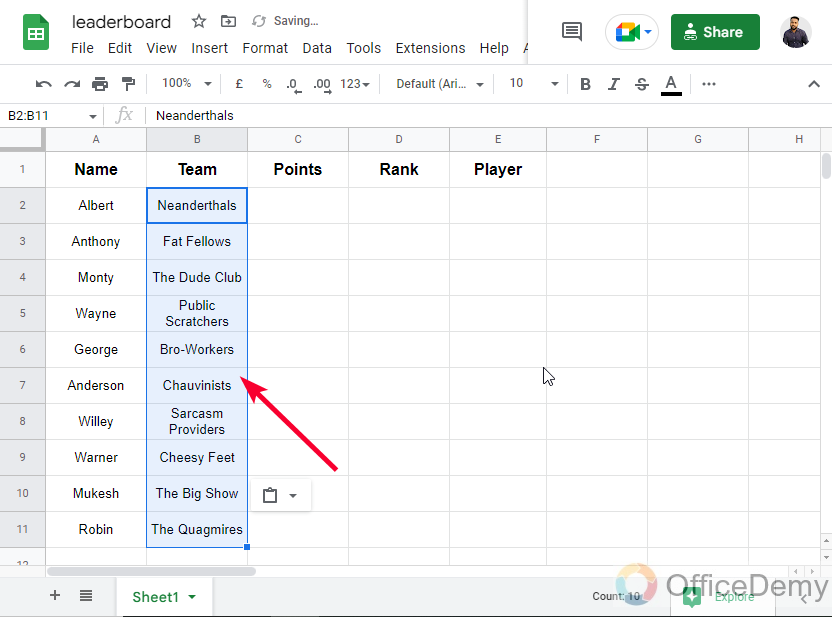
Step 4
Add Dummy team names for the players
Step 5
Add random points for them (between 400 to 1000, just a random range)
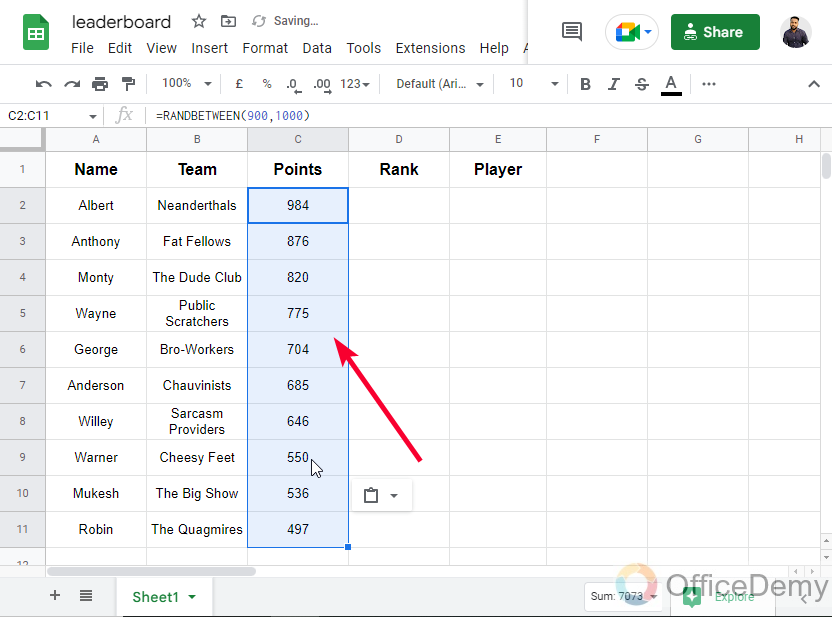
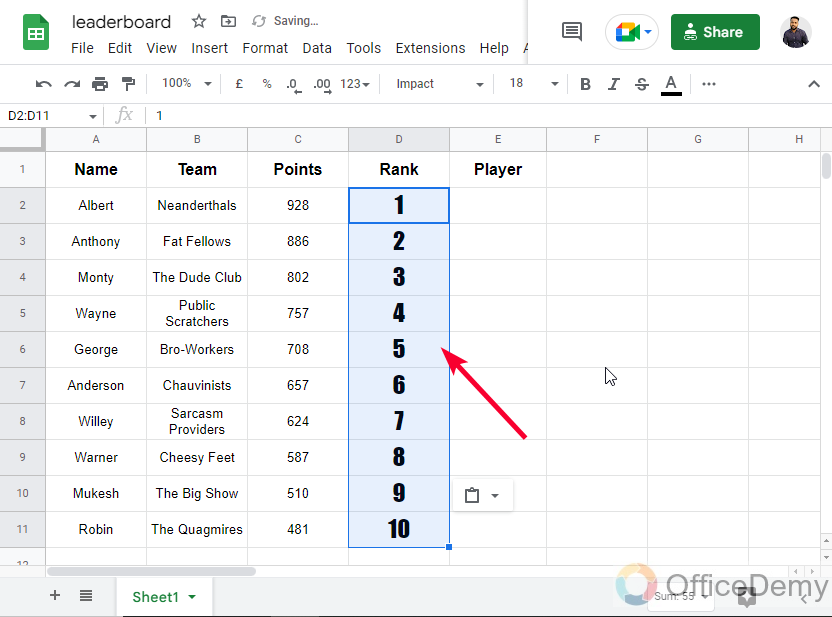
Step 6
Give players rank based on their points
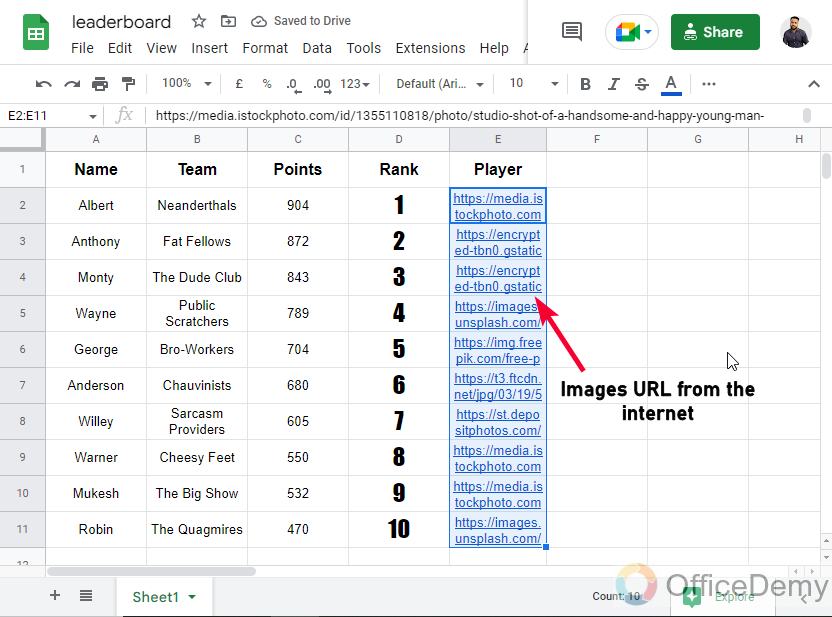
Step 7
Find images on the internet (from copyright-free sources), copy their link, and paste them into the image columns for each player.
So, here is your complete leaderboard data completed.
The above data is quite enough to visualize a leaderboard in Google Data Studio. So, let’s move ahead and connect this Sheets file with a Google Data Studio report to proceed to create a leaderboard.
Create a Leaderboard in Google Data Studio – Connecting Sheets with Data Studio
In this section, we will learn how to create a leaderboard in Google Data Studio, and we will see how to connect the leaderboard’s sheets file with a blank Google Data Studio report. So, let’s see how to do that.
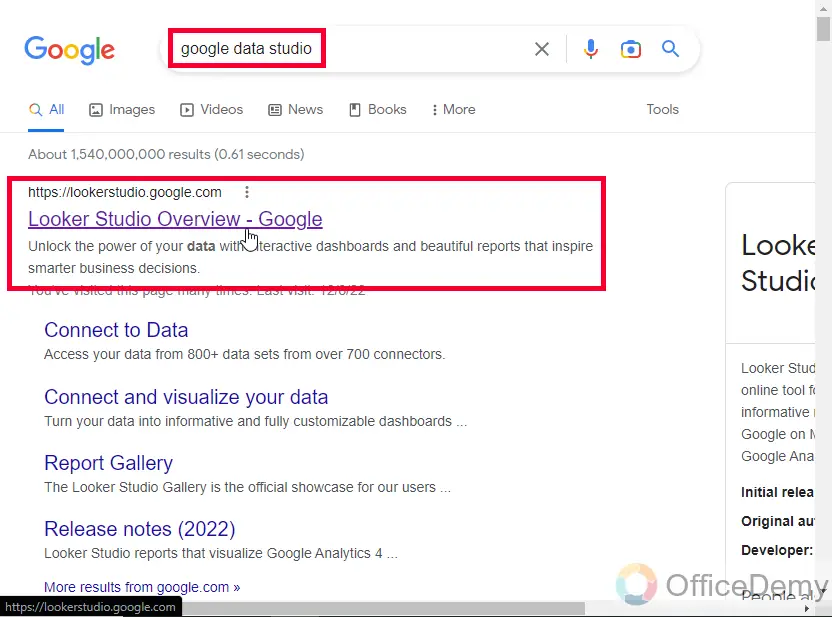
Step 1
Open Google Data Studio
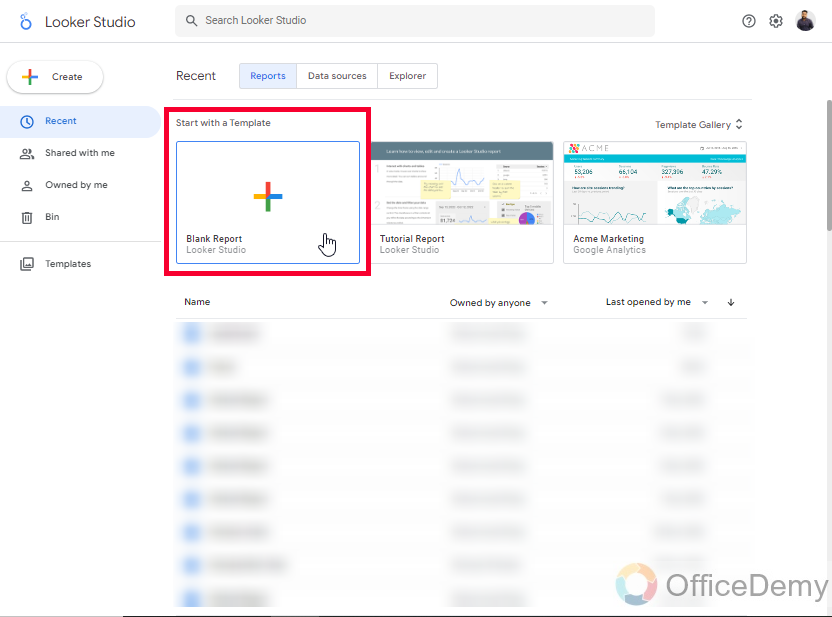
Step 2
Create a blank file, using the starter template
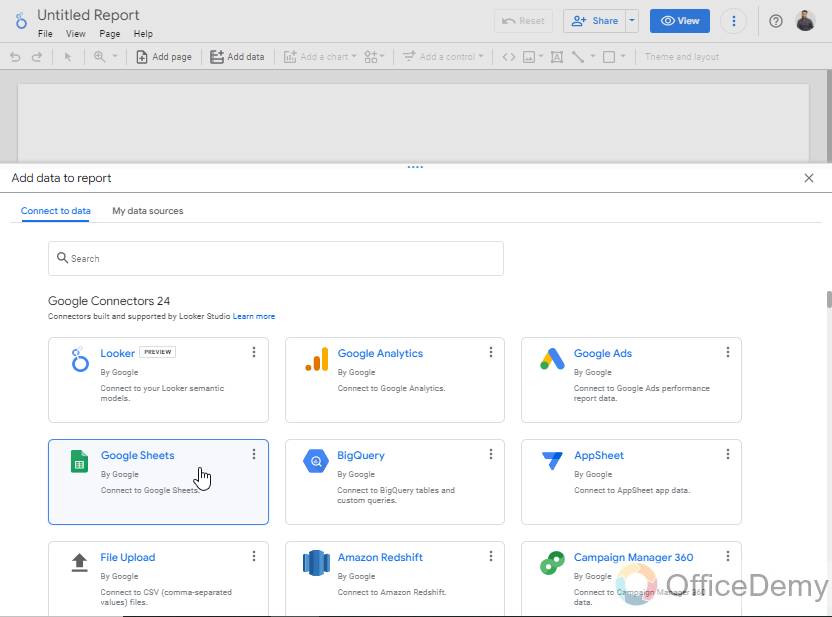
Step 3
It will ask you to connect to a data source, scroll down and look for Google Sheets in the list
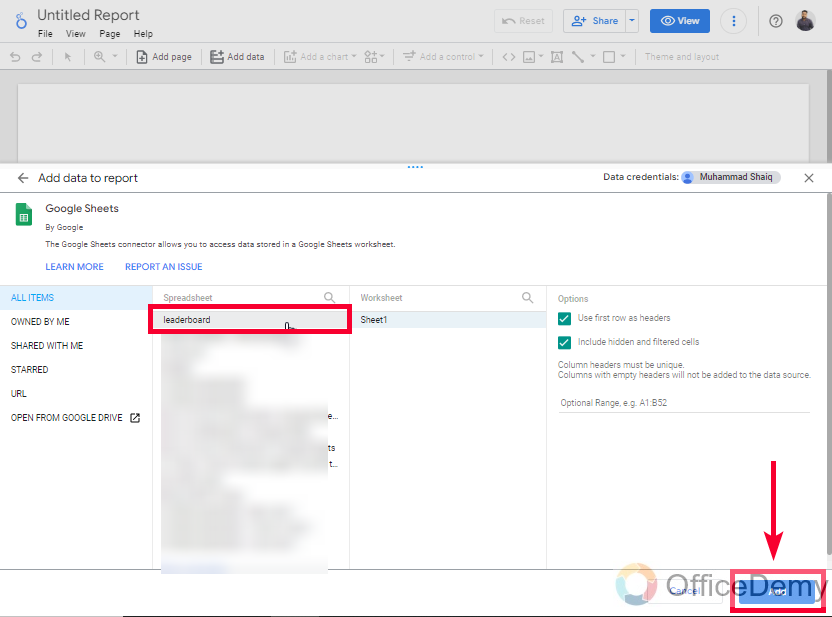
Step 4
Click on the Sheets, and now choose a file (all these files are from your Google Drive, so make sure you must have the leaderboard’s data file in your Drive). Then click on the add button, and the report will be started with this data
Now you have successfully connected your leaderboard’s Sheets file with a new Google Data Studio Report before we start working, we need to set up the data sources, and manage data types for each field. So, let’s quickly see some important things after a successful data connection.
Create a Leaderboard in Google Data Studio – Set up Data Types and Fields
In this section, we will see how to set up data types for the dimensions, and how to set up a new image field inside the data source to show images from the link. If you skip this section, you will not be able to visualize your images. See the below steps carefully.
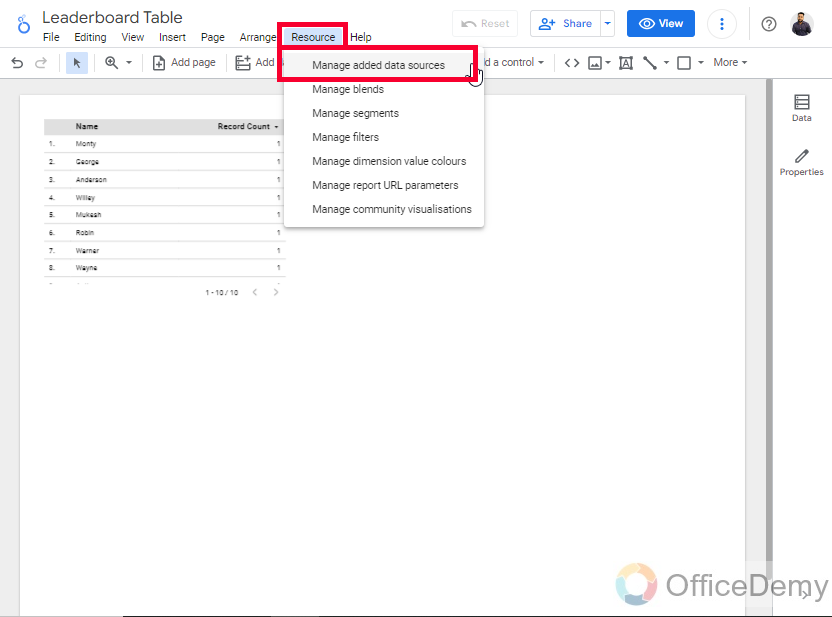
Step 1
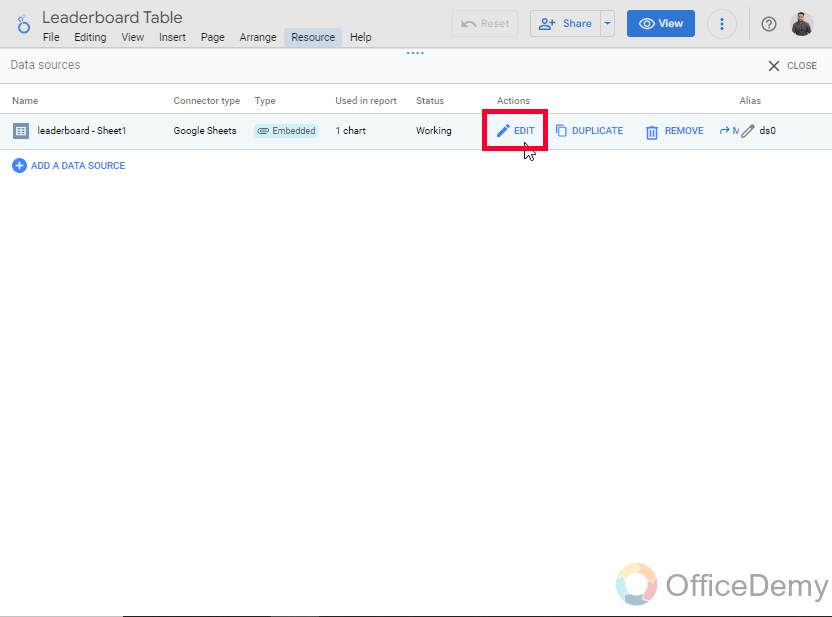
Go to Resource > manage added data sources
Step 2
Click on the Edit button on your connected data
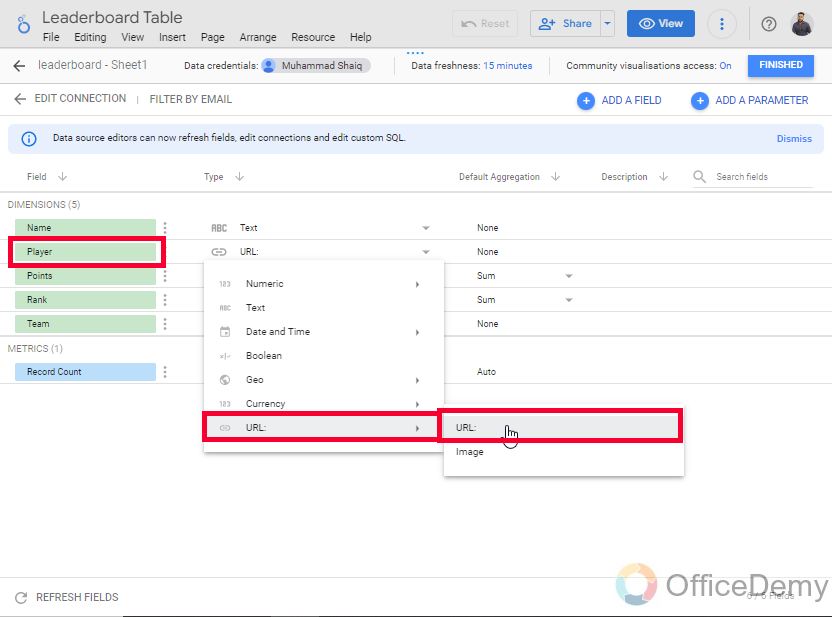
Step 3
Here are all your data fields, change the data type for Player/Image to URL, as we have the URL of the images in this column
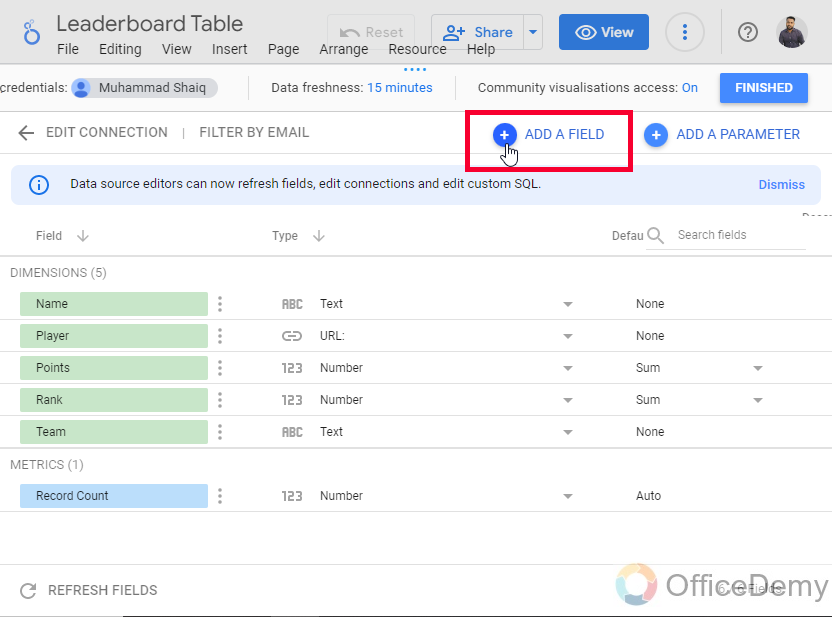
Step 4
Now, on the top right side, click on the “ADD A FIELD” button
Step 5
Provide a meaningful name to your field, you will be using this field for your images, so you can give any relevant name such as images, photos, player images, and so on.
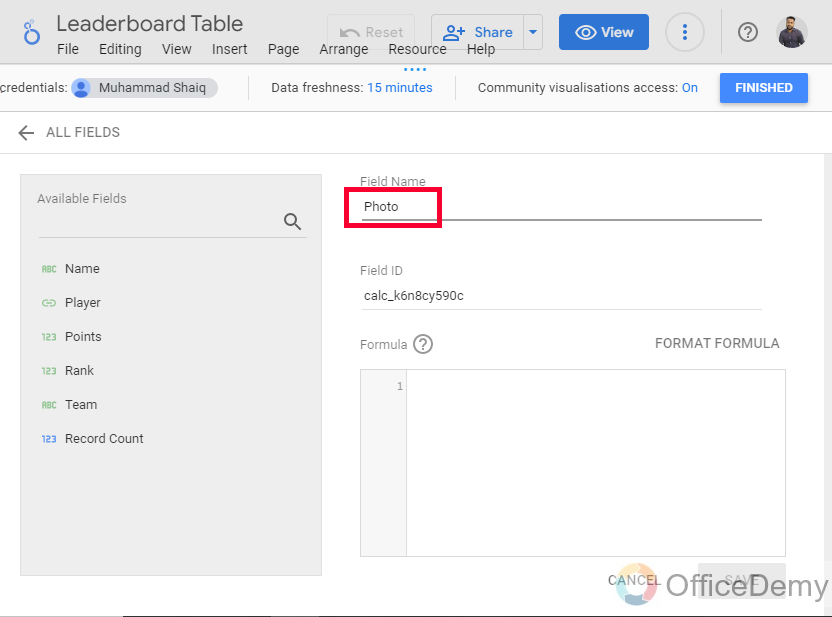
Step 6
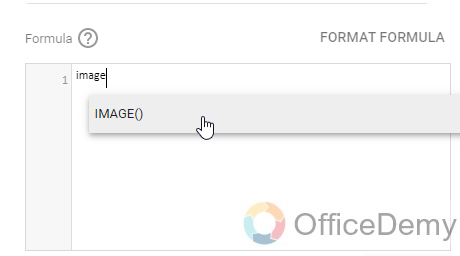
In the formula tab below, write a simple formula
First, write the Image function name
Image()
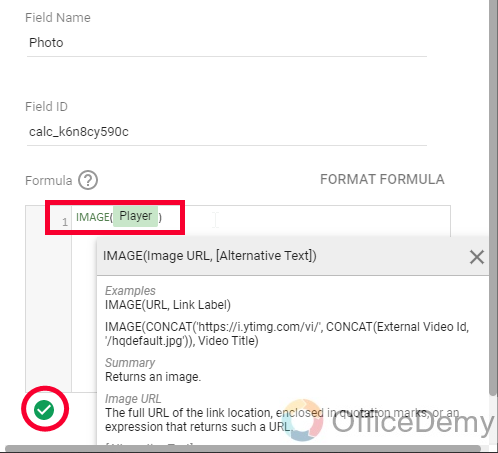
Then, in the parentheses, write your image field name, not the name that you have given to this function, but the actual name the image URLs column has in your Sheets file.
So, the formula in my case will become
Image(Player)
You will see a green tick mark, that specifies the formula is valid. Click on the Save button below.
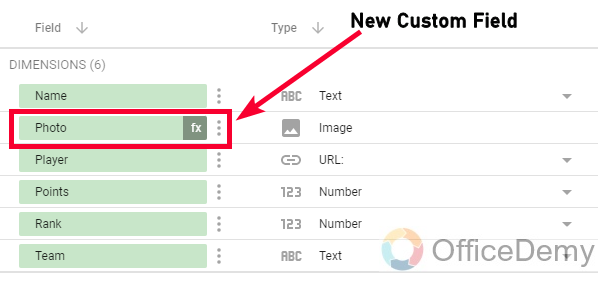
Step 6
Now you have a new field with the name you selected in the previous step and an fx symbol (indicating that it’s a custom formula field), showing it as a custom field.
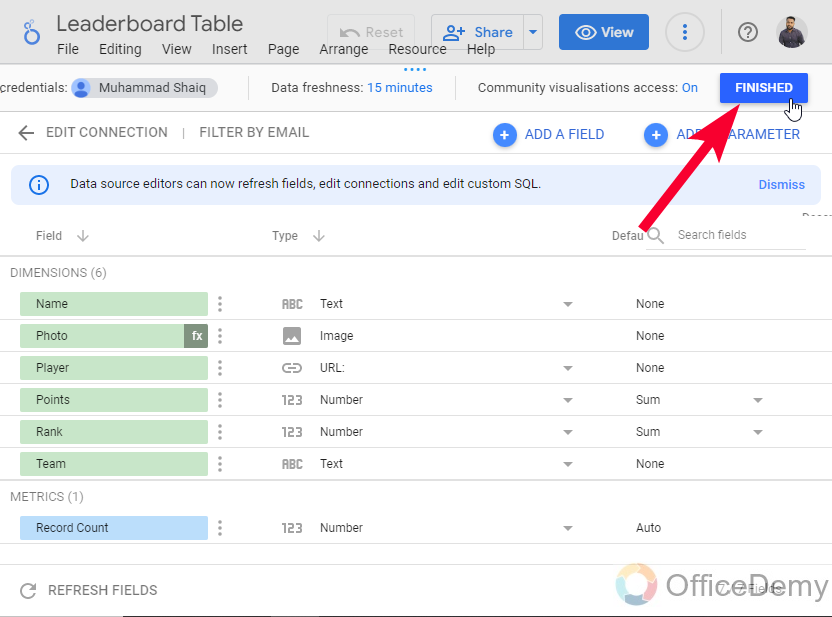
Step 7
Click on the FINISHED button on the top right side to back to your report.
Now, we have everything we created the Sheets file, connected it with Data Studio, and set up custom fields and data types as well, now it’s time to start making the leaderboard in Google Data Studio.
How to Create a Leaderboard in Google Data Studio – Create a Leaderboard using a Table
Finally, in this section, we will learn how to create a leaderboard in Google Data Studio, and we will use a simple built-in table to create it. So, let’s get onto the Data Studio canvas and start working.
Step 1
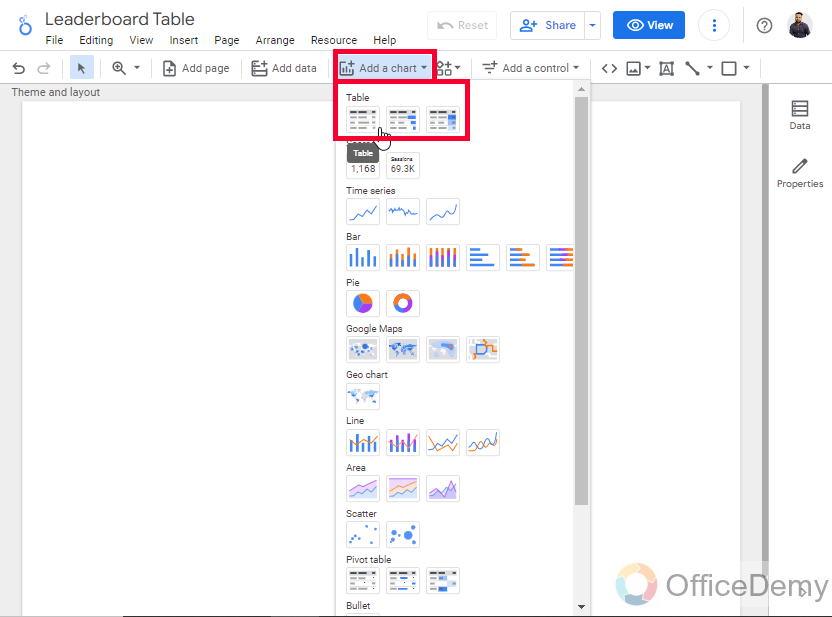
Go to the “Add a chart” dropdown and select a Table
Step 2
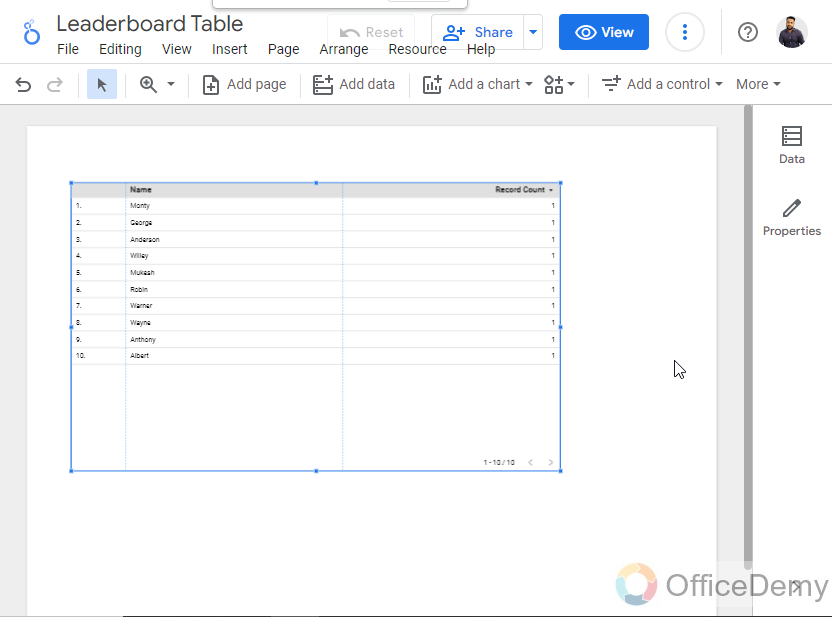
Draw the table on your canvas.
The table is created and its default dimension and metric
Step 3
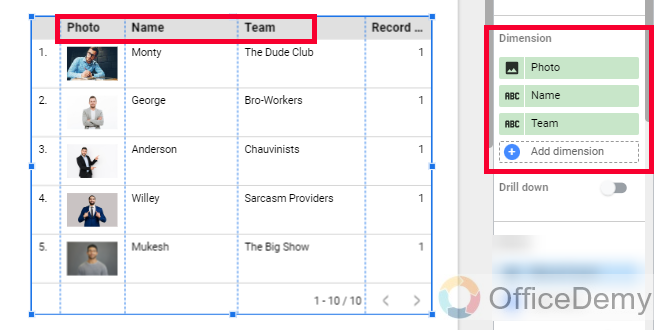
Let’s change the dimension first, we will add the Image, Name, and Team name in the dimension.
Step 4
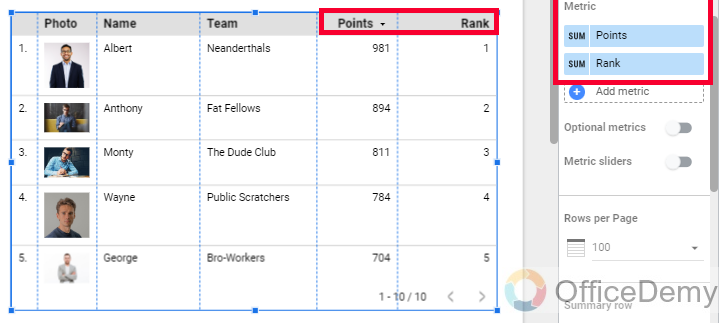
Now, we need to change/add metrics, we will remove the default metric, and will add points and Rank in the metrics
Note: For adding images into the dimension, you will have to select the formula field, not the original field, otherwise, it will show only links and not the actual images.
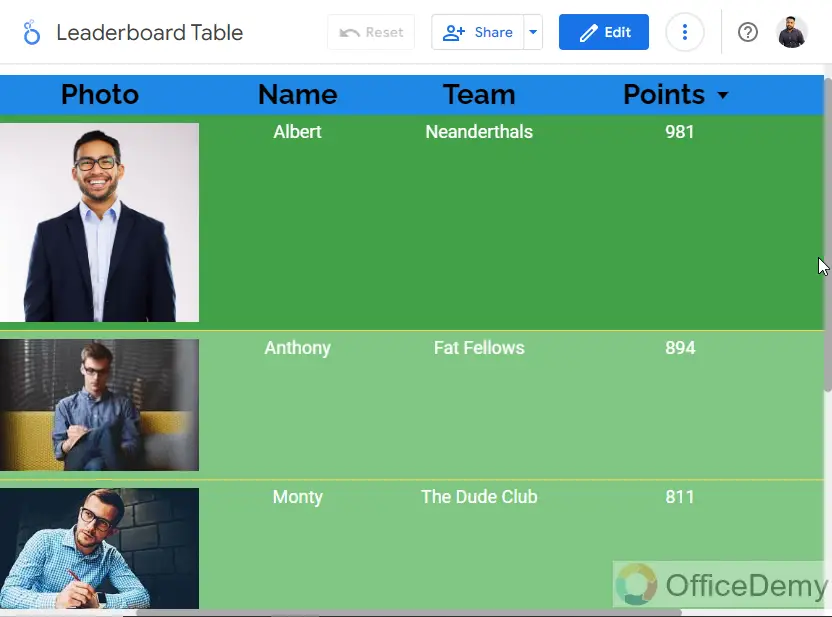
Step 5
Now, you can see the leaderboard is almost ready. Now, the only thing we need to do is customize this leaderboard and make it more beautiful.
Create a Leaderboard in Google Data Studio – Customize a Leaderboard
Finally, we have created a good-looking leaderboard in Google Data Studio. This is the last section which covers the customization of the leaderboard, or you can say the customization of the table. So, I will not go into many details, I will only show some key customization features, hence it’s not a customization tutorial. So, let’s see some quick styling for our leaderboard.
Step 1
Add a conditional formatting rule on the Rank field, and specify that keep the color Green for the one who is in the first position, this will look good.
Step 2
Add another rule for the conditional formatting on the Rank field, and this time keeps the colors lighter green for position 2 and 3, this will look pretty cool.
Step 3
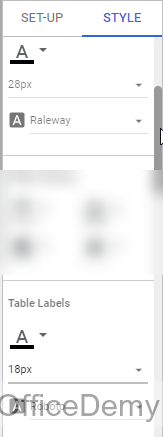
Increase the font size, change the font family, and change the font color if you need.
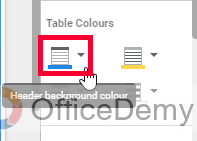
Step 4
Below, in the table colors section, you can use odd rows and even rows colors, it makes look a table very cool, but if you are already using the conditional formatting rules, then skip these colors, and only use a (light) background color for the entire table.
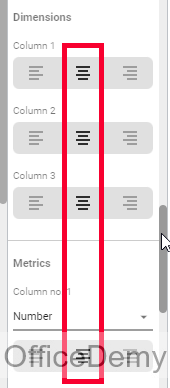
Step 5
Adjust the alignment and placements of the cells and the cell’s content
There are so many more designing, and customization features available for the tables, but since we are customizing this table as a leaderboard, and not as a static table, the above customizations will be enough.
That’s all about how to create a leaderboard in Google Data Studio.
I hope you find this tutorial helpful.
Get a Free Leaderboard data Sheets File here
Get a Free Leaderboard’s table template for Data Studio here
Frequently Asked Questions
Can I Add Images to a Leaderboard in Google Data Studio?
Yes, you can add images to a leaderboard in Google Data Studio. This feature allows you to enhance your data presentation by visualizing data with images. Simply select the image field in the properties panel, and the leaderboard will display both numeric data and corresponding images for a more engaging and informative report.
Conclusion
Thank you for reading our tutorial. We learned how to create a leaderboard in Google Data Studio from scratch to the final product. I will see you soon with another useful guide. Keep learning with Office Demy.


