
To Make a Timeline on Google Docs
- Open a blank Google Doc.
- Change page orientation to landscape.
- Use Google Docs’ drawing tool.
- Draw a horizontal line as the base.
- Add arrowheads to both ends.
- Create vertical lines for event durations.
- Add event information in text boxes. Customize text boxes.
- Add time durations below the line.
- Save the timeline in Google Docs.
OR
- Open your Google document.
- Install the LucidChart add-on.
- Sign in with Google within the LucidChart pane.
- Use LucidChart to create your timeline.
- Save the timeline in LucidChart.
- Insert the timeline into your Google document.
In this article we will learn about how to make a timeline on Google Docs using two different approach.
Timelines allow you to produce graphical representations of specific moments in the past. Historically, timelines were used to show events in a particular sequence. Now, schools, businesses, and government agencies use timelines to outline workflows.
Managing several projects and trying to be on top of everything will streamline your work if a simplified timeline is made. Using Google Docs, you can create a simple yet effective timeline that will direct your efforts.
What is a Timeline?
A timeline is a chronological display of events. It’s used to organize and illustrate stories, to help people understand the chronology of an event, to give context to an event, or to show a sequence of events.
A timeline is typically organized in a graphic way and shows a series of events, the dates they occurred on, and the people involved in them. Timelines can range from simple lists of events to complex illustrations of interactions among multiple groups over time.
How to Make a Timeline on Google Docs
If you have a product or a company, you might want to create a timeline for it.
Timelines are really helpful for your business because they are able to tell a story about your brand. They help people understand the history and journey of your brand and make them feel more connected with it.
If you want to make a timeline for your brand, then this guide on how to make a timeline on Google Docs will come in handy.
In this article, we will share with you the process of creating a timeline in Google Docs from start to finish. We will also tell you how to add images, videos and links in your timeline and more importantly, how to create a beautiful infographic out of it!
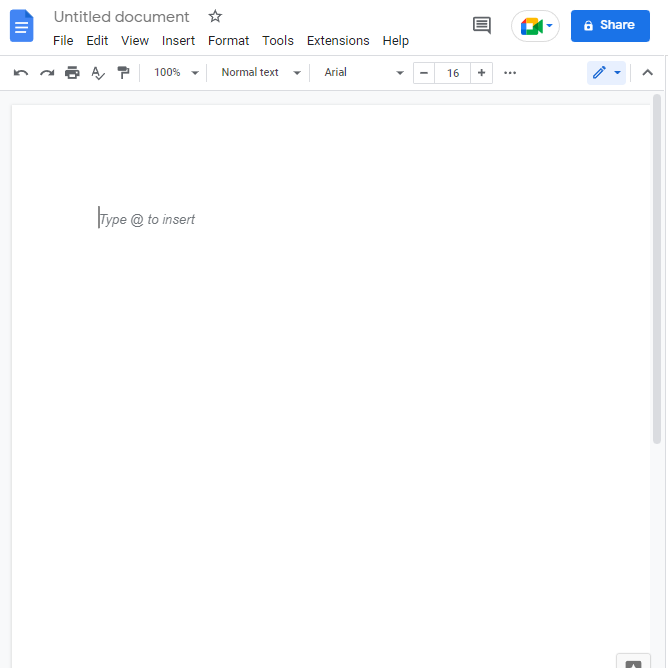
Step 1: Go to your google docs. Open a blank document where you would like to add a timeline.
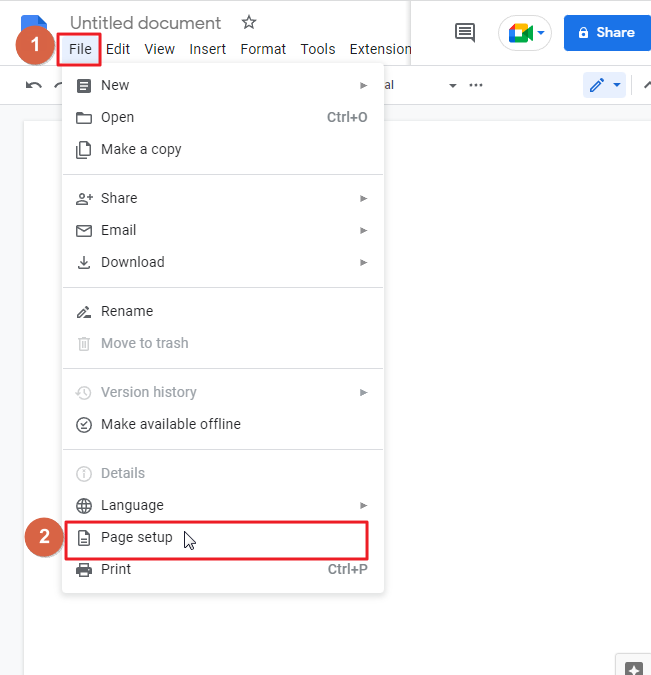
Step 2: You need more substantial space in order to build a chart that groups events on a timeline. The default orientation is set to Portrait mode after you create a blank document. To increase the space of the pages, you should change the orientation. To do so, click on file in the menu bar. A dropdown menu will appear. click on Page setup.
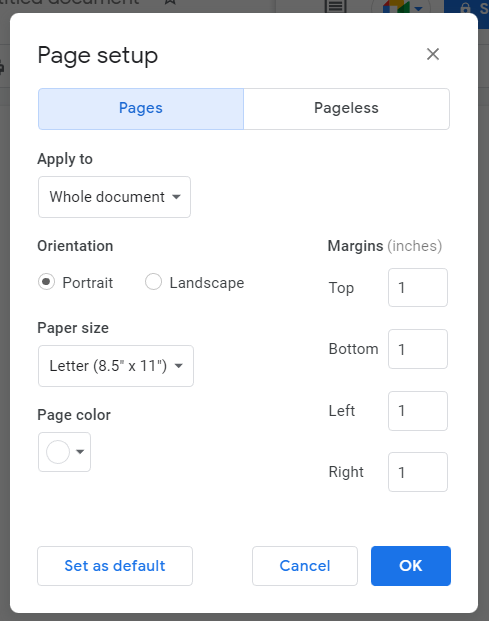
As soon as you click on page setup, a popup window will appear on your screen.
Step 3: Change the orientation to landscape. Click ok.
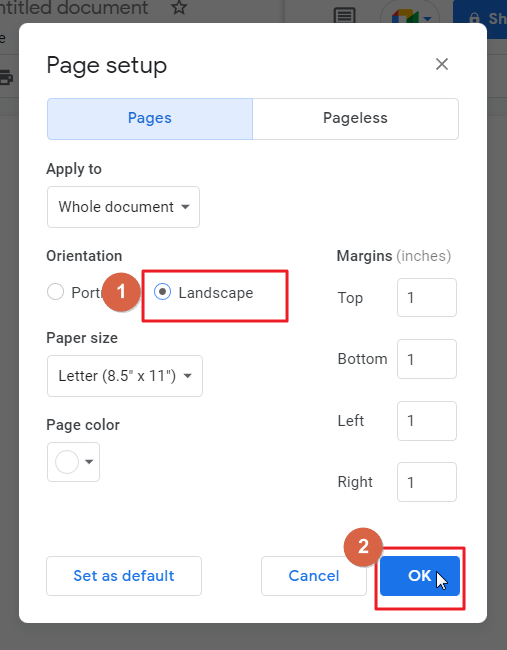
After clicking the OK button, the blank page gets switched to Landscape mode, allowing you to make the desired modifications.
Step 4: It’s now possible to begin making the timeline with a drawing tool provided by Google Docs. click on insert in the menu bar which is at the top on your screen. a dropdown menu will appear. click on Drawing > Click on New.
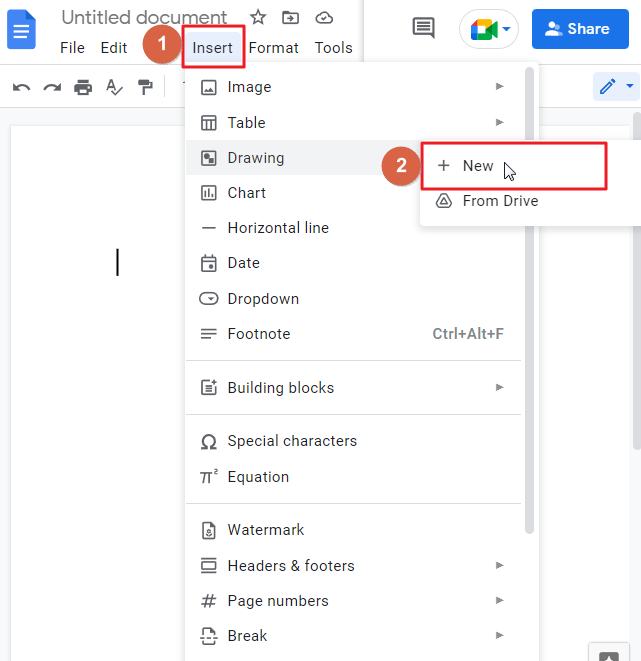
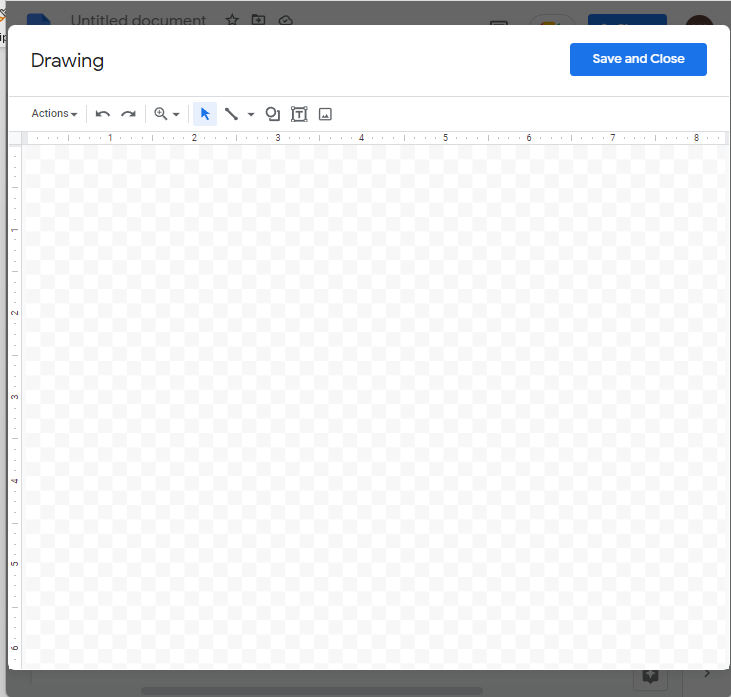
A new window will open on your screen where you can draw.
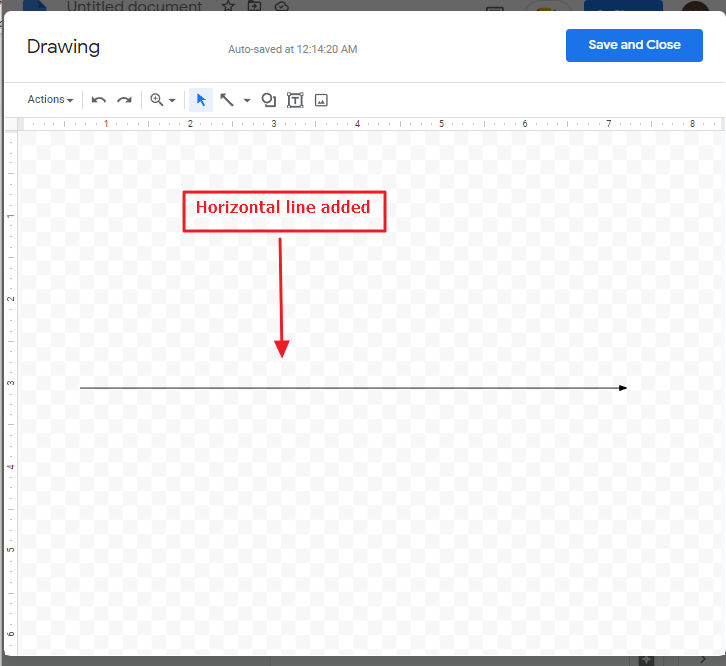
Step 5: It’s time to begin with the horizontal base of our timeline. Click on line in the menu bar. A dropdown menu will appear. from the dropdown list, select the arrow line style.
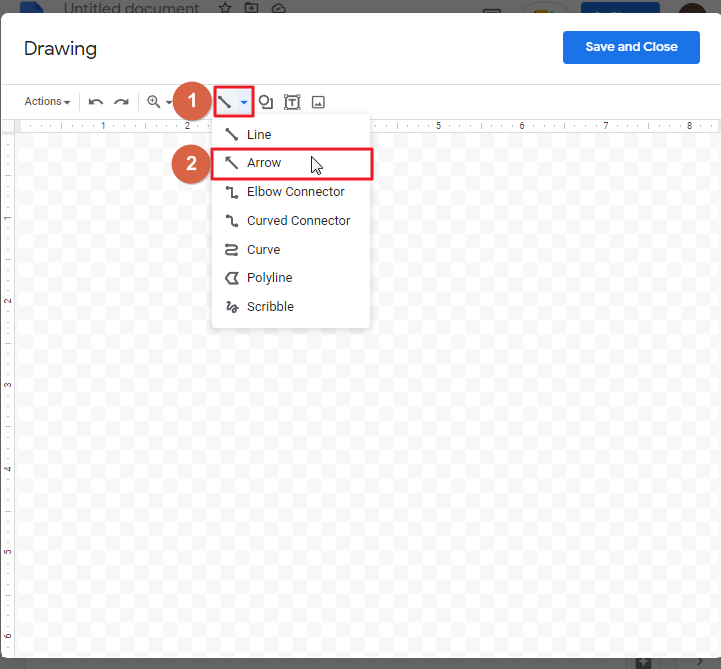
Hold the left mouse button and drag the cursor to create a straight horizontal line on the screen.
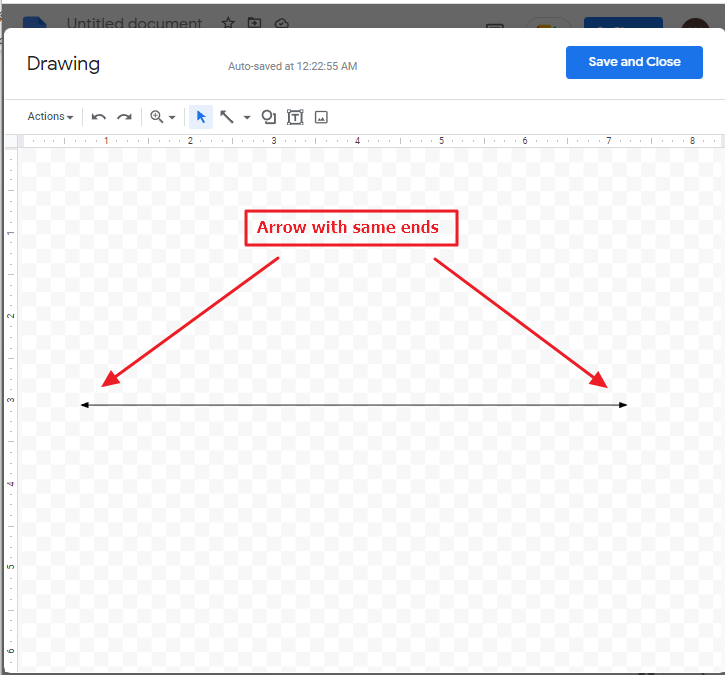
Step 6: To set up both side ends with arrows, select the horizontal line first so that the line start icon in the menu bar enables. Click on line start icon in the menu bar. A dropdown menu will appear. select an arrow style that you have already used for the horizontal line so that both the edges will have the same arrow.
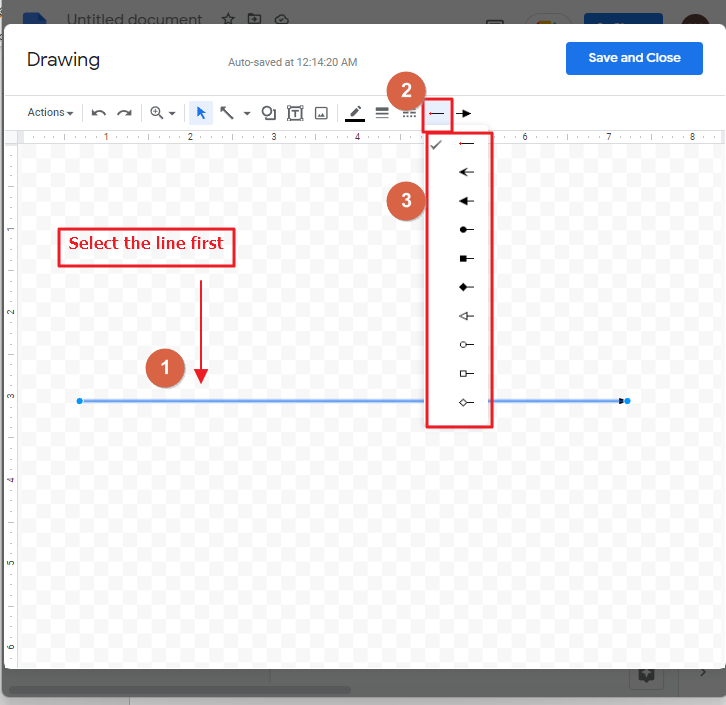
I have selected an arrow style that matches the first arrow style and it has appeared at the beginning.
Bonus tip
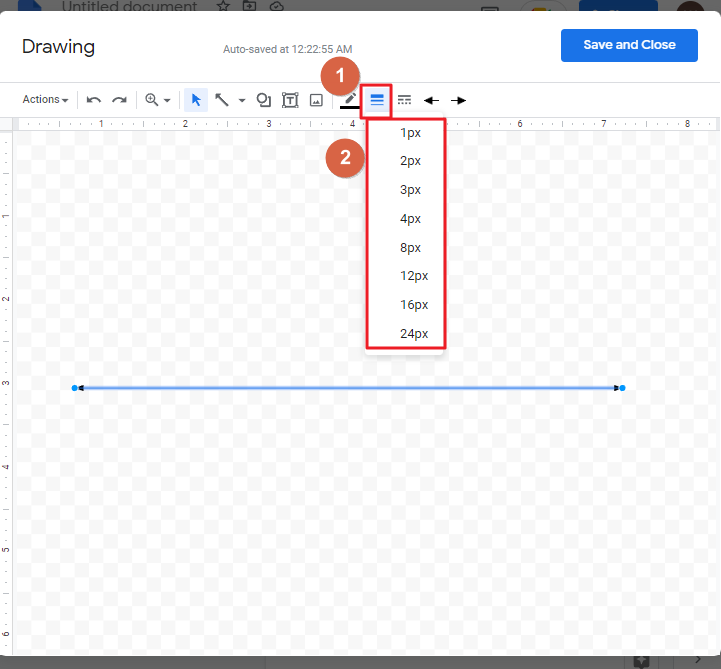
If your line is liking too thin, you can change its weight too. To do so, click on the line so that the line weight icon in the menu bar will be enabled. Click on the line weight icon in the menu bar. A dropdown menu will appear. select a weight according to your preference.
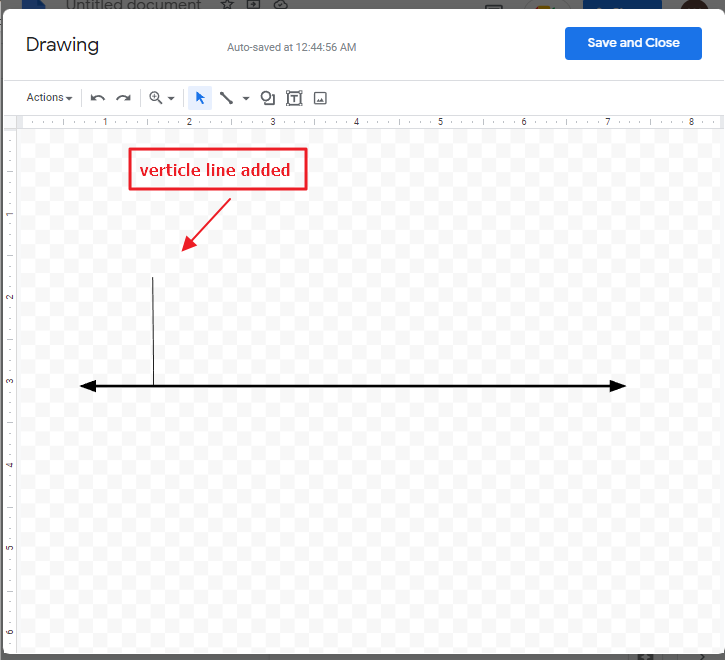
Step 7: To make it look appropriate, Place a vertical line above the horizontal line. We will be using these lines to identify the duration in between two actions in future. To do so, click on line in the menu bar. A dropdown will appear. click on line.
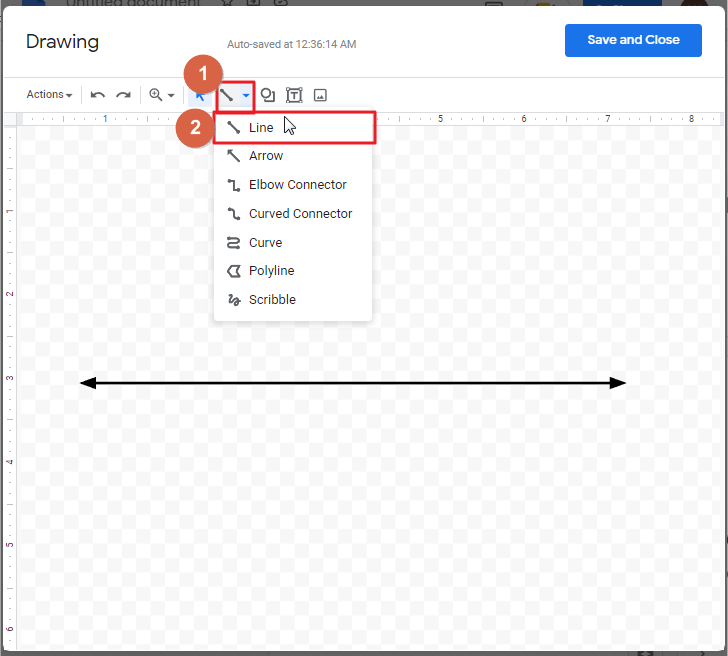
Place your cursor over the horizontal line and left click towards upward direction to create a vertical line. Upon achieving your desired line height, release the click.
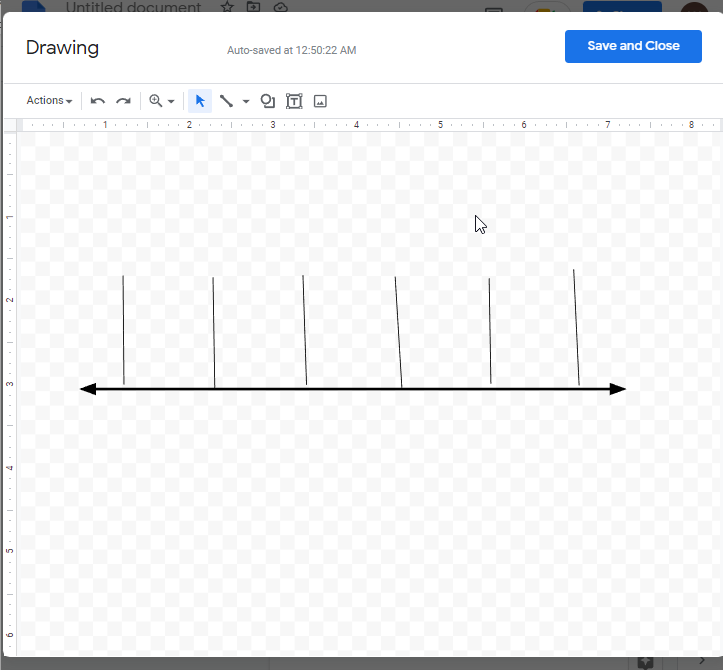
You can make clones of this branch according to your needs. We will form six copies so we can display here six consecutive days.
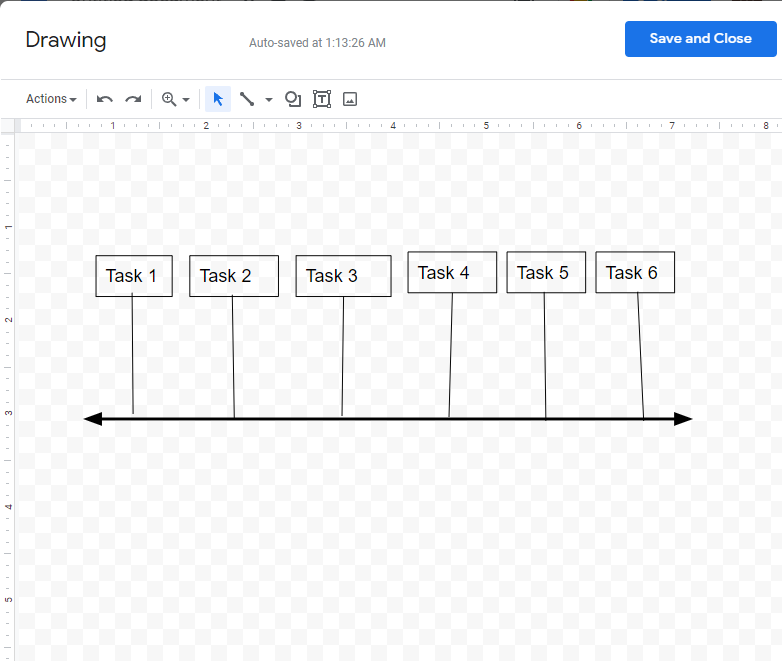
Step 8: We’re going to add the information that will be used to establish the timeframe for the project. Make sure to develop a short summary of the data you will need and work on that. To do so, click on the textbox icon in the menu bar. Place the textbox above the vertical line and add some data about your task.
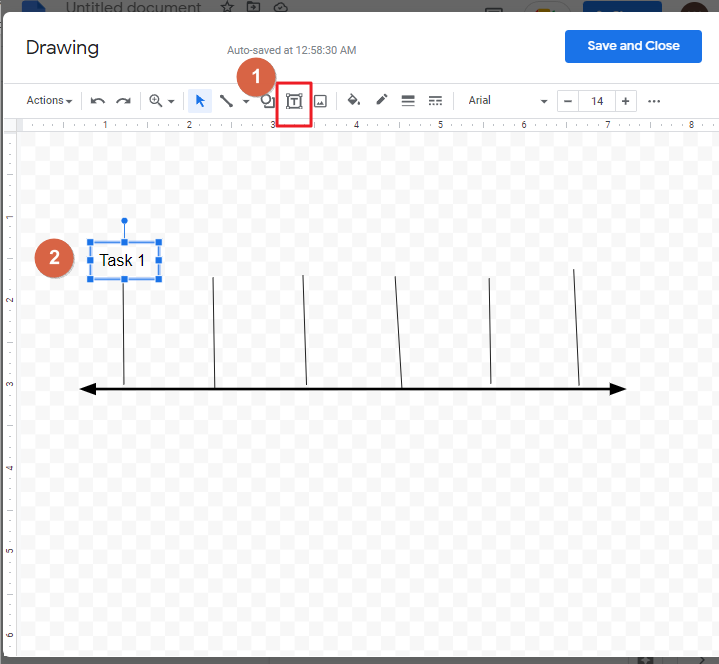
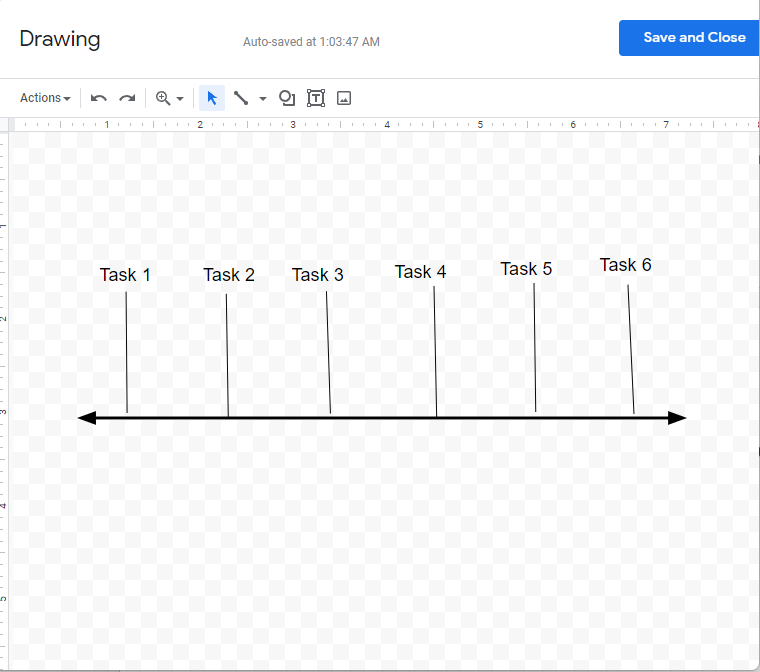
Place the textbox above every vertical line to establish work sequence chronologically.
Bonus Tip
At this point, you can add some variations on your timeline. You change the font style, font color, font size etc. you can also add border around the task details if you want. To do so, click on the task textbox so that the border dash icon will be enable in the men bar. Click on the border dash icon in the menu bar. A dropdown list will appear. select a border style according to your preference.
If you want your timeline to look attractive, you can add colors too inside the task boxes. To do so, click on the task box so that the fill color icon in the menu bar will be enabled which is disable by default. Click on fill color in the menu bar. A list of colors will appear on your screen. Select a color according to your preference.
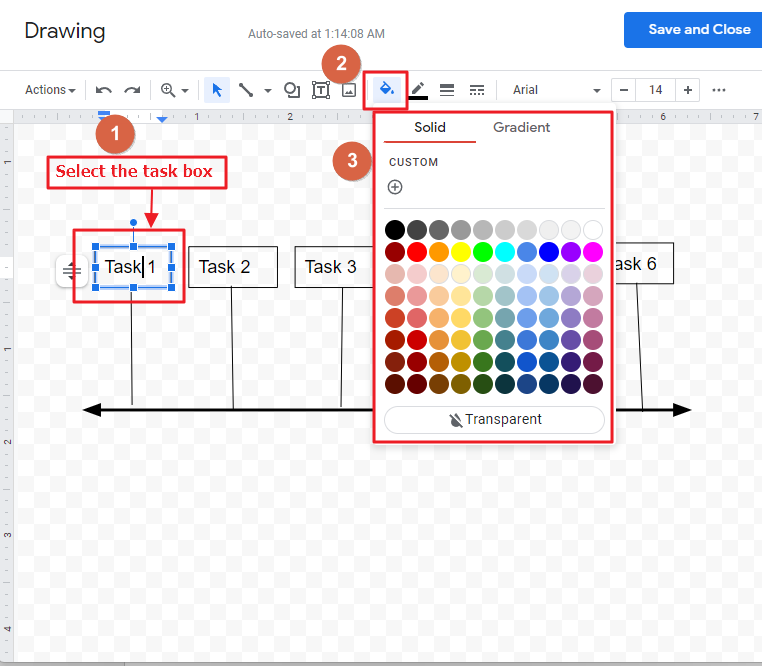
For example, I have selected light green color for the task boxes.
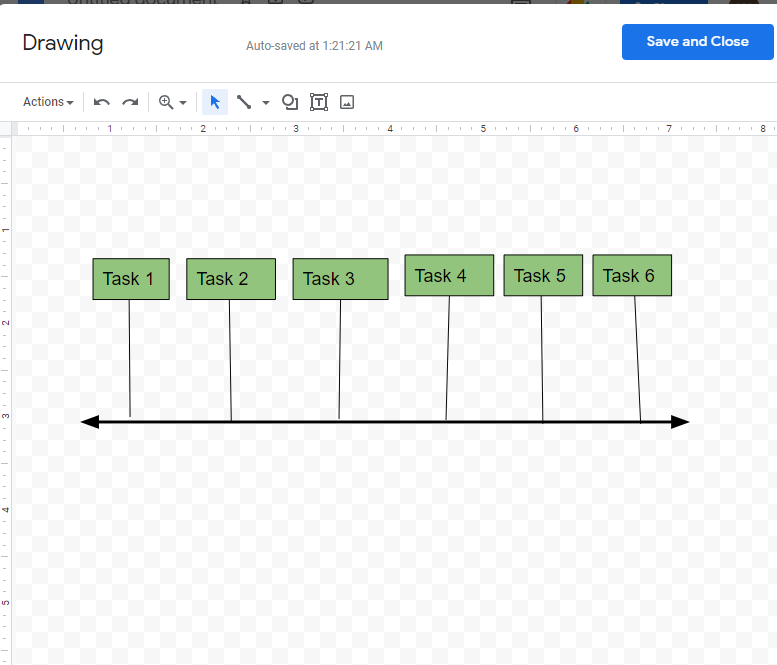
You can add any color you want from the list of colors.
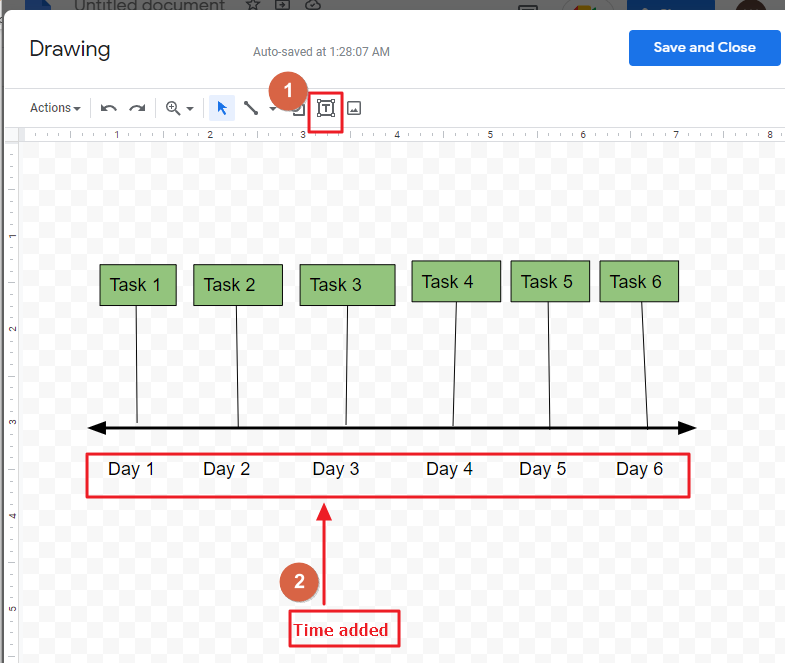
Step 9: Now time to add the time duration. Click on the textbox in the menu bar. Place the text box below the horizontal line, just under every vertical line and add time.
Bonus tip
For best results, utilize the various image/shapes tools shown above when you wish to show Coterie Timeline charts that includes certain images. For this, you just need to click on the tools icon in the menu bar and pick out the pictures from your computer system or you can add shapes too using menu bar.
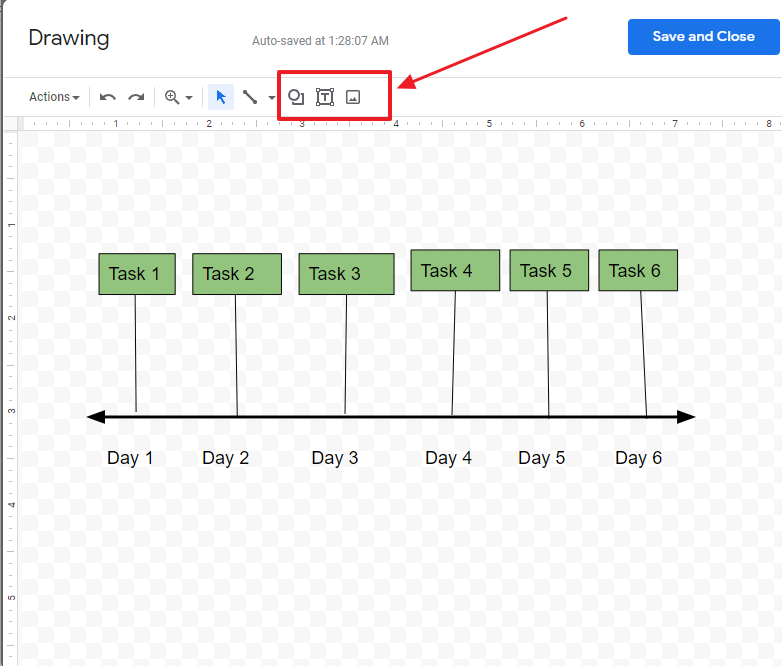
Step 10: After you have made the correct changes to your chart, you’re ready to move on and save the Timeline. Saving your work may be impossible unless you click Save and Close on the top-right corner of your drawing window.
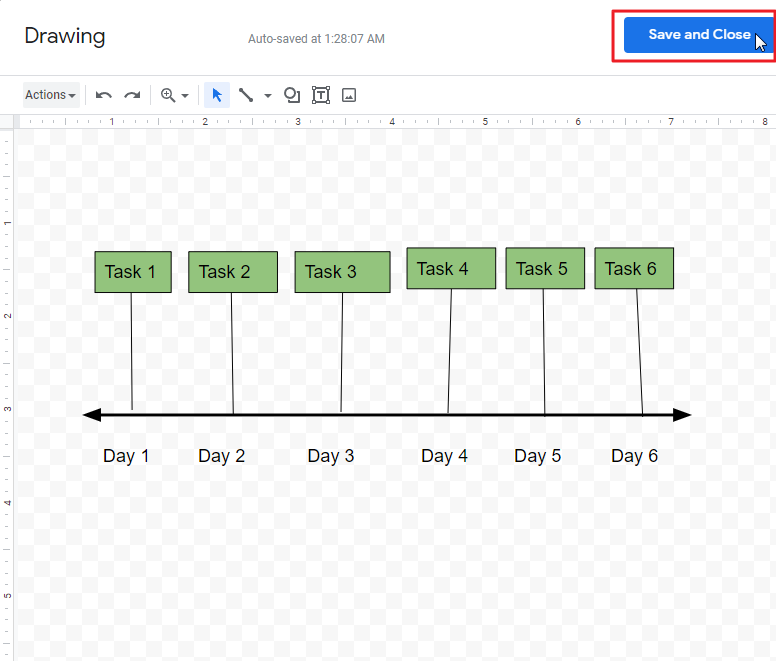
Your time line will appear on your google document immediately.
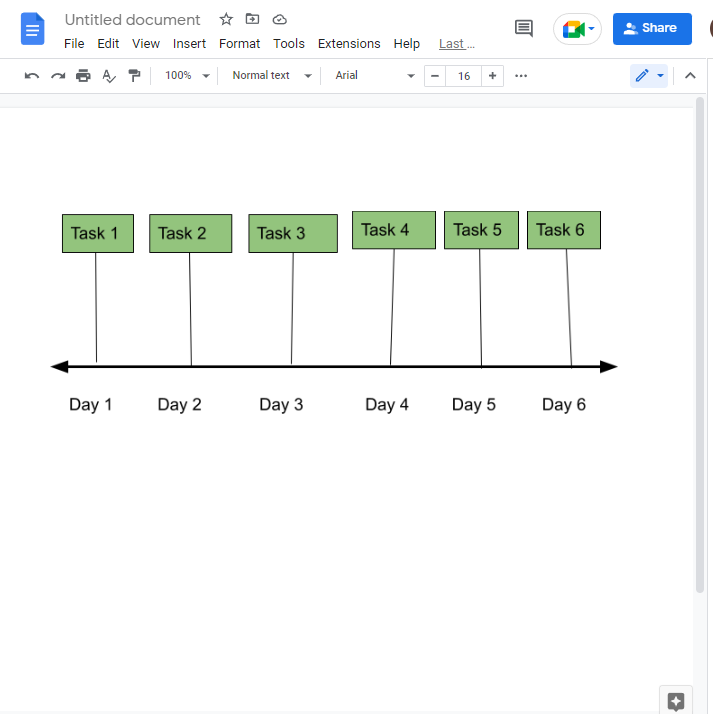
That it. You are done.
How to Make a Timeline on Google Docs using LucidChart Add-on
Lucidchart can be used to make an alternate timeline on Google Docs. You can make a timeline using Google Docs by searching for a plugin called Lucidchart.
Follow these steps to create timeline using lucidchart on google docs,
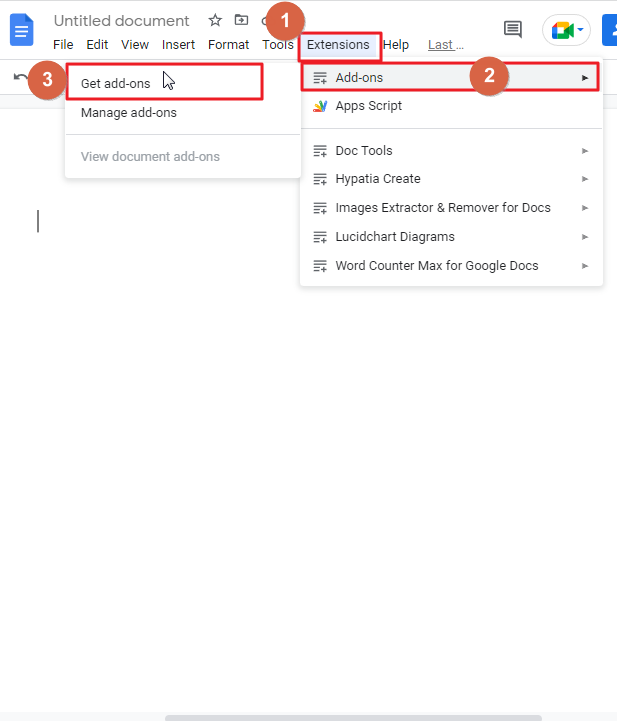
Step 1: open your google document. click on extensions in the menu bar. A dropdown menu will appear. click on Add-ons. Click on Get add ons.
Step 2: as soon as you click on the get add ons, a new window will appear on your screen. Type lucidchart in the search bar. Press Enter on your keyboard.
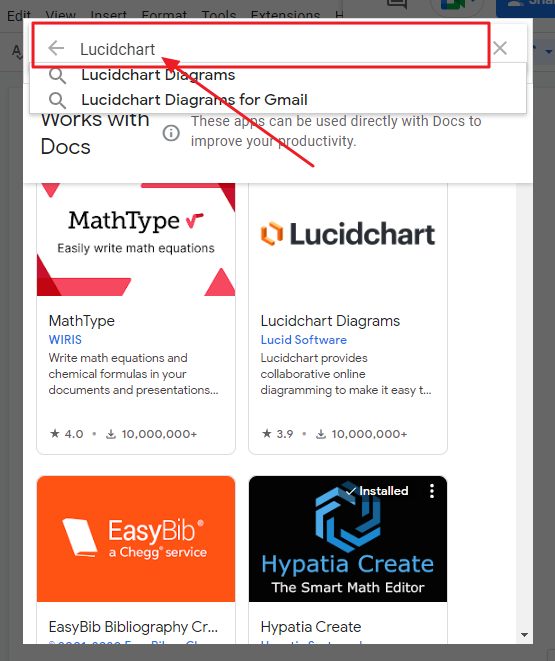
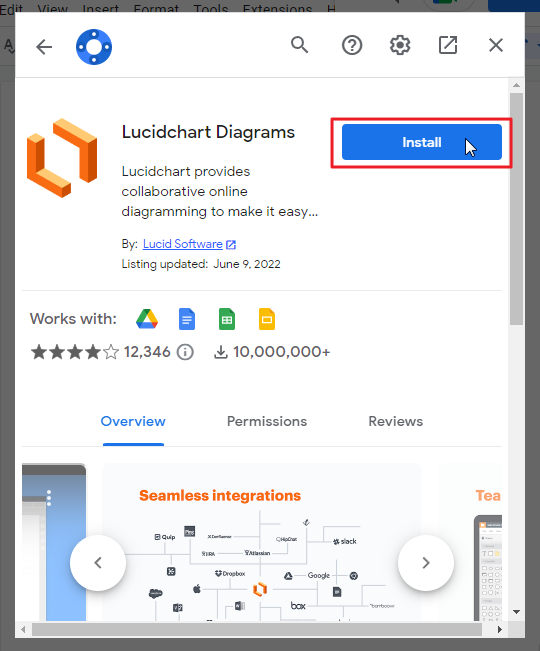
Click on lucidchart diagram, click on install.
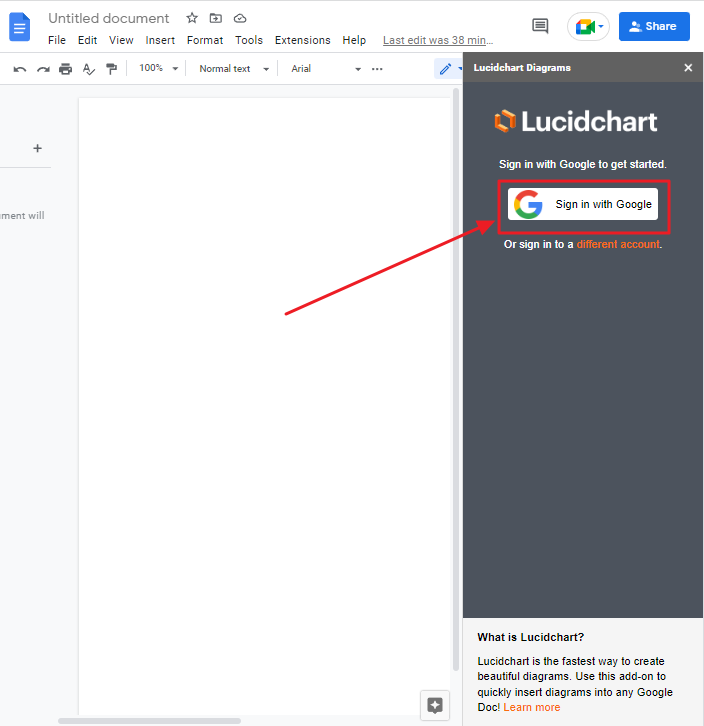
Step 3: once you have installed the lucidchart diagram, go back to your google document. you will see lucidchart pane in the right side of your window. Click on sign in with google.
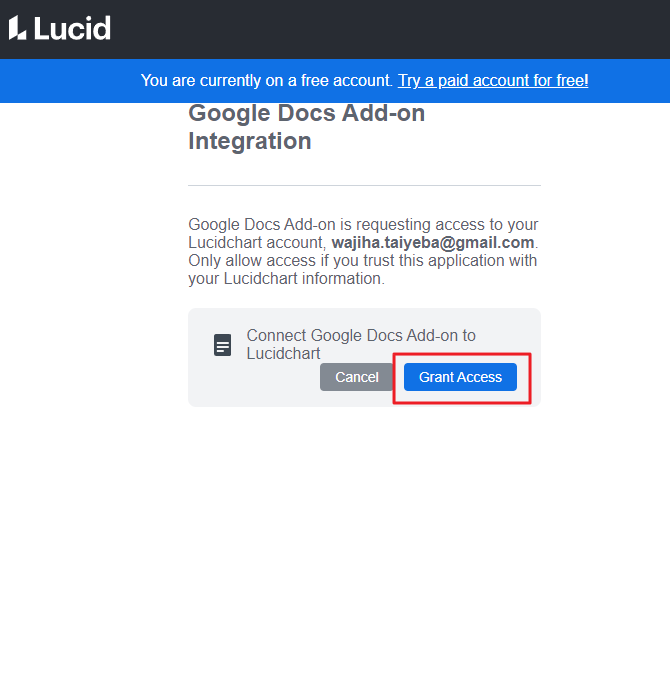
Step 4: With Lucidchart, follow the procedure, and then the account will be activated.
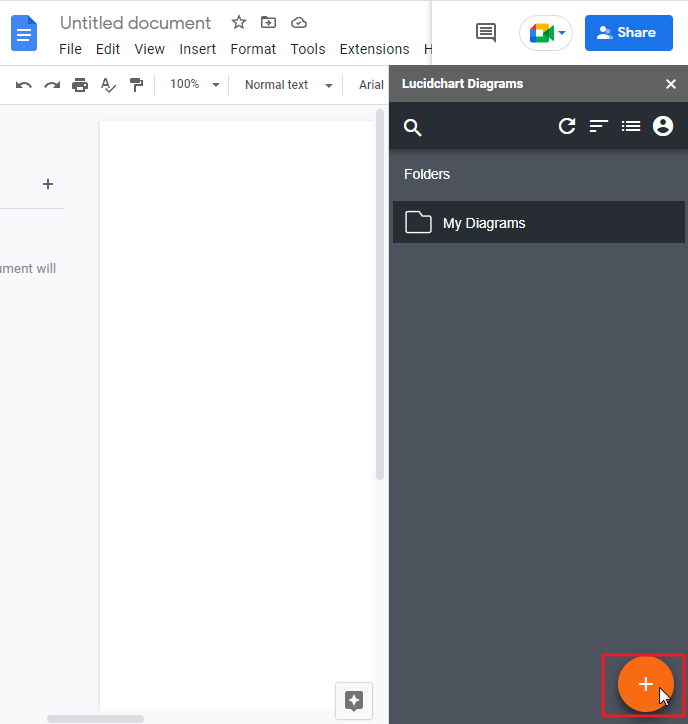
Step 5: Click on the Plus sign located at the bottom right of your window.
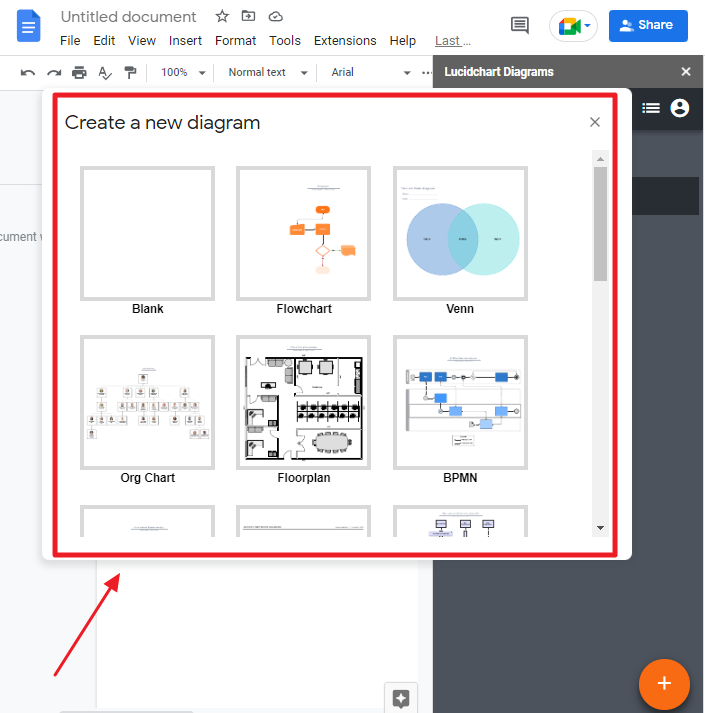
Step 6: Another option is to choose a blank document or a template from the pop-up.
Step 7: if you want to create a timeline diagram by yourself, click on Blank on the popup.
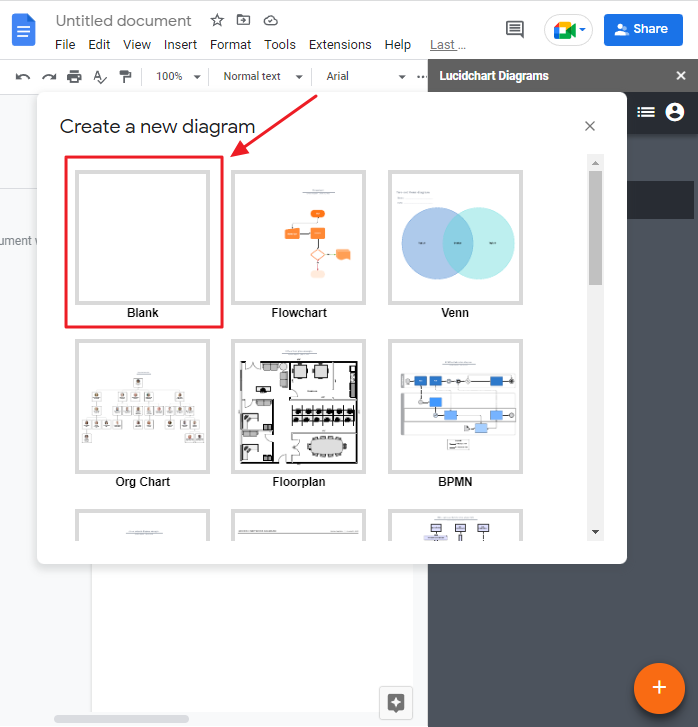
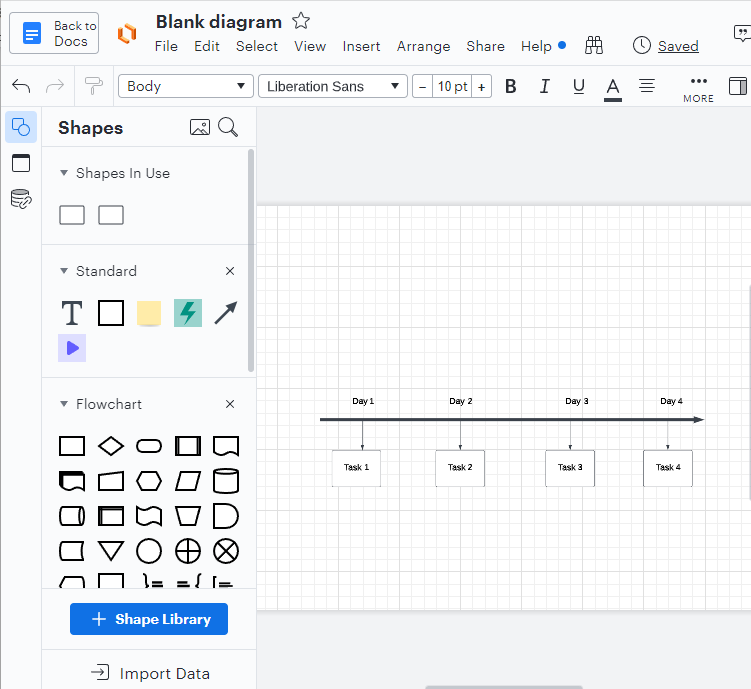
You will be taken to a new tab where you can create a timeline using lucidchart.
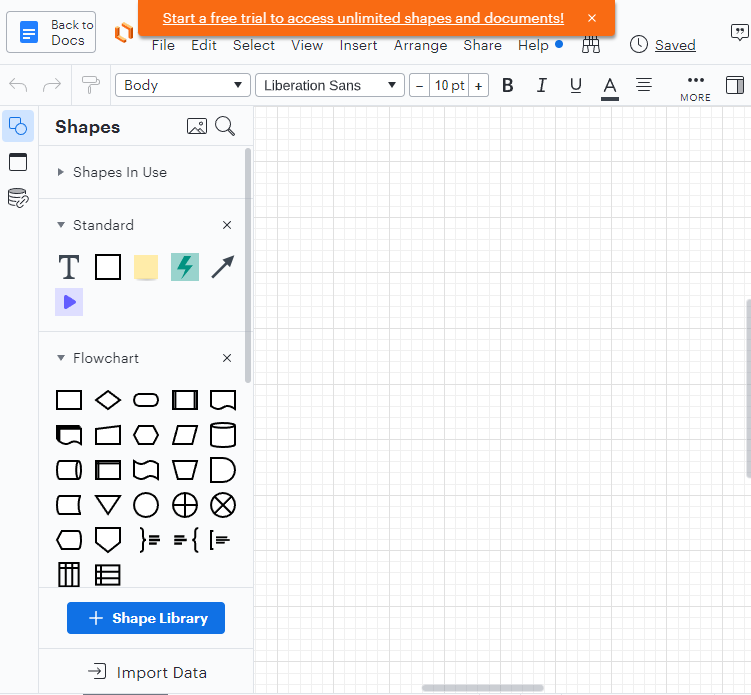
Step 8: create your timeline using the tools that are shown at the left of your window. I have created one timeline according to my preference.
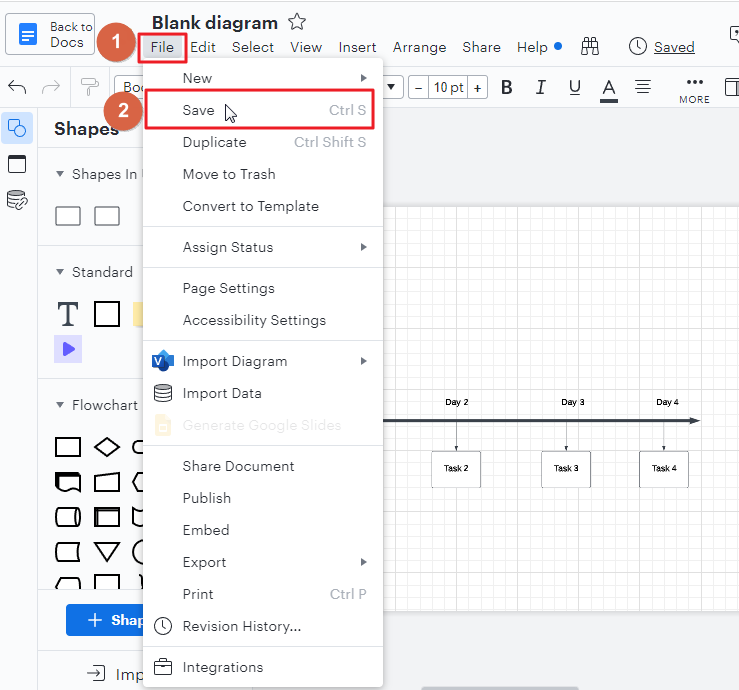
Step 9: when you have completed your timeline in lucidchart, its time to save it. To save your new timeline in lucidchart, click on file in the menu bar. A dropdown will appear on your screen. click on save.
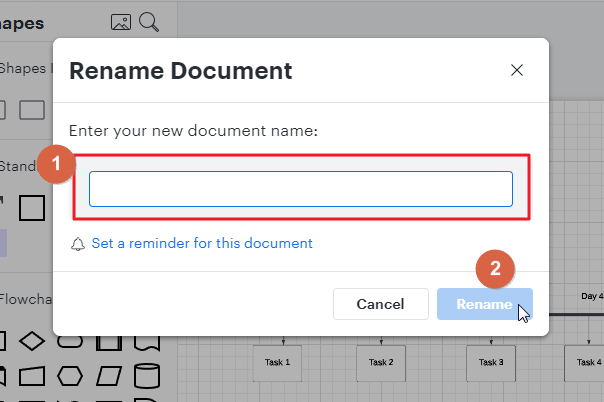
Provide a proper name to your document. click on rename when done.
Step 10: Go back to your google document tab. You will see your newly added timeline. Click on the timeline so that it will be added to your google document.
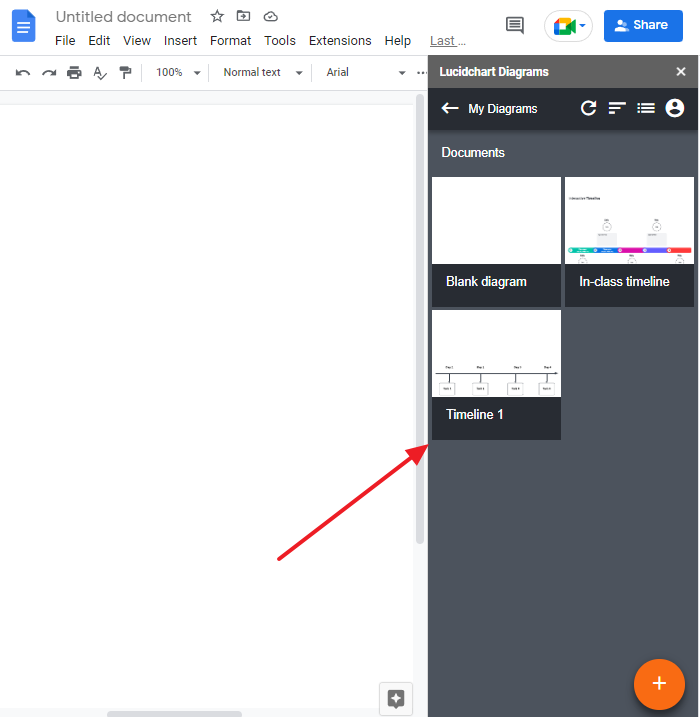
Click on insert.
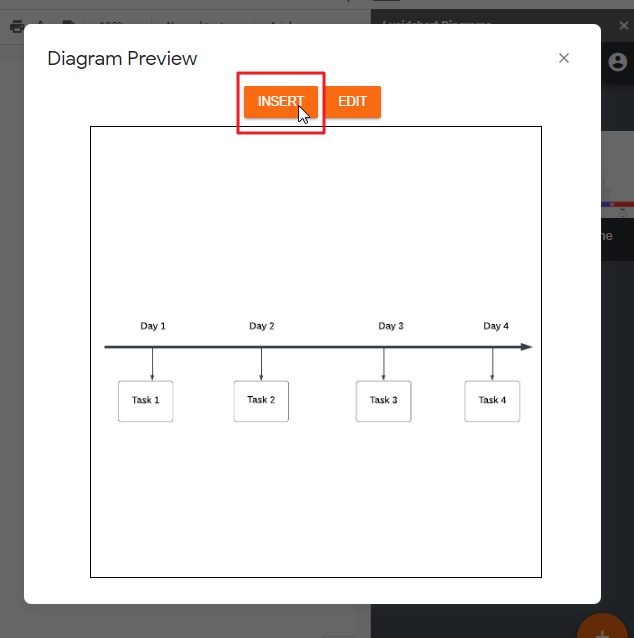
Your timeline will be added to your google document.
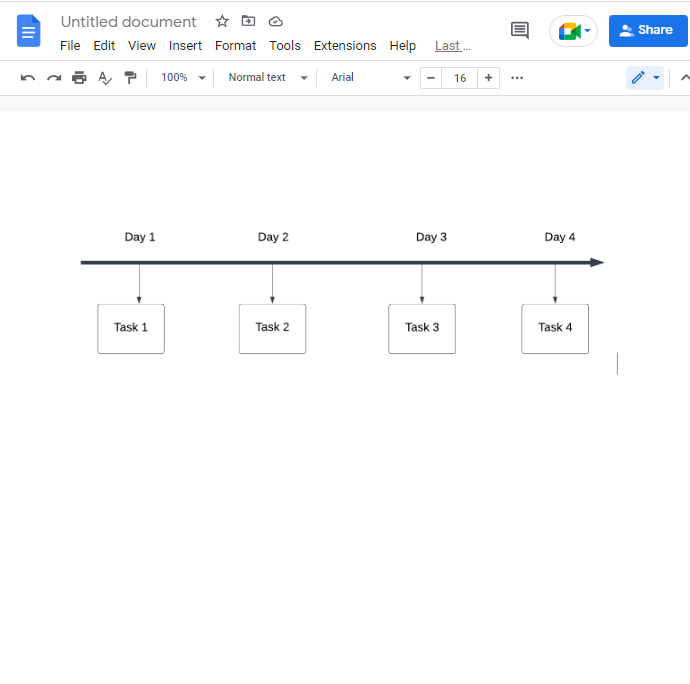
That’s it. You are done.
Video Tutorial: How to Make a Timeline on Google Docs
Frequently Asked Questions
Can I Use the Same Template for Making a Timeline in Microsoft Word and Google Docs?
Yes, you can use the same microsoft word timeline template for creating a timeline in both Microsoft Word and Google Docs. Simply download the template and import it into either platform. This way, you can easily create timelines in the software of your preference without having to recreate the same template from scratch.
Are the Steps to Make a Timeline on Google Slides Similar to Making One on Google Docs?
Yes, the steps for creating a timeline in google slides are similar to making one in Google Docs. Both platforms offer easy-to-use tools, allowing you to add shapes, lines, and text boxes to create a visual representation of events. With the keyword creating a timeline in Google Slides, this paragraph answers the prompt concisely.
What types of timelines are possible?
When events develop in a functioning manner, appropriate timelines can often exist in numerous layouts. A timeline retains the same level of importance while delivering information in different ways.
There are several ways we can divide timeline types into categories.
By Objective
- Project timeline: It will help you visualize a project’s tasks, activities, and milestones.
- Historical timeline: The story unfolds sequentially over time.
By design
- Vertical timeline: The vertical flow highlights events with long descriptions.
- Horizontal timeline: A text that contains events, data elements, and descriptions is presented in horizontal form.
- Roadmap timeline: In the process of completing, a function maps out milestones, from beginning to completion, for every type of project.
- Infographic timeline: You can use an attractive, eye-catching design to present your ideas.
Why should we use a timeline in google docs?
Too often, individuals make presentations in Google Docs. It is very important that individuals understand how to build a timeline in Google Docs because it can help them visualize how a company has grown from its beginnings.
Timelines are used by investors to analyze the performance of securities.
Timelines are not restricted to charts because you’re seeking a comparison, review, or inspection over a period of time. This can be accomplished for many purposes, such as tracking performance, assessing the value of something, or estimating the losses and gains of a specific business.
You finally have the ability to apply a timeline to demonstrate the sequence of events in an article, or to isolate various facts in a research document.
Does Google docs offer a timeline template?
Regrettably, there’s no official Google Docs template you could use to create your own timeline. You could potentially adapt an MS Word template, but any you might find online were of poor quality and not worth paying for. Using Google Docs’ built-in drawing tool to generate an outline to rapidly construct a timeline is quite convenient.
You can insert template editors and timelines during document editing and use free add-ons to generate your document.
Developers of such free add-ons have added composing and editing capabilities and timelines to documents.
What sort of schema makes up a project timeline?
A project timeline graphically itemizes your workflow. It provides a helpful view of the planned work for managing the staff and scheduling deliverables.
What is a chronology timeline?
A timeline graph is an ideographic illustration of historical events and their order. It’s an excellent way of taking notes, and it will help keep data retained.
Does PowerPoint offer a timeline template?
Yes, PowerPoint includes a collection of basic visual layouts that users can customize and edit to create a simple chronological timeline.
Can I make a timeline using google docs?
Yes, you can. You can use the drawing tool or Lucidchart to create a timeline in google docs.
From Google Docs, can I share my Lucidchart document?
No, rather than that, you can click your email address in the sidebar on the Lucidchart site to share.
Will I be able to connect a Lucidchart account to any other Google account?
Lucidchart does not require users’ Google account.
How will my diagram appear on Google Docs?
Diagrams ought to be sharp and clear. They’ll automatically scale to the width of the page, and you may resize the image by pulling on its corners to a position that you like.
Conclusion
Creating a timeline in Google Docs is one of the best ways to present a variety of information and make it easy to understand. You can easily add and format text, images, video, and other types of content to create an engaging narrative that helps you make your point.
While there are several different approaches you can take when creating a timeline in Google Docs, there are also many limitations on what you can do with the app’s drawing tools. Therefore, if you want to create something aesthetically pleasing or more complex than a basic chronological list of events, it may be best to use another tool entirely.
The good news is that most of these third-party tools are free for individuals to use; however, some offer paid upgrades with additional features or professional support options as well.
I hoped you enjoyed my ideas on how to make a timeline on google docs, so the article dealt with the end.


