
To Make a Venn Diagram on Google Slides
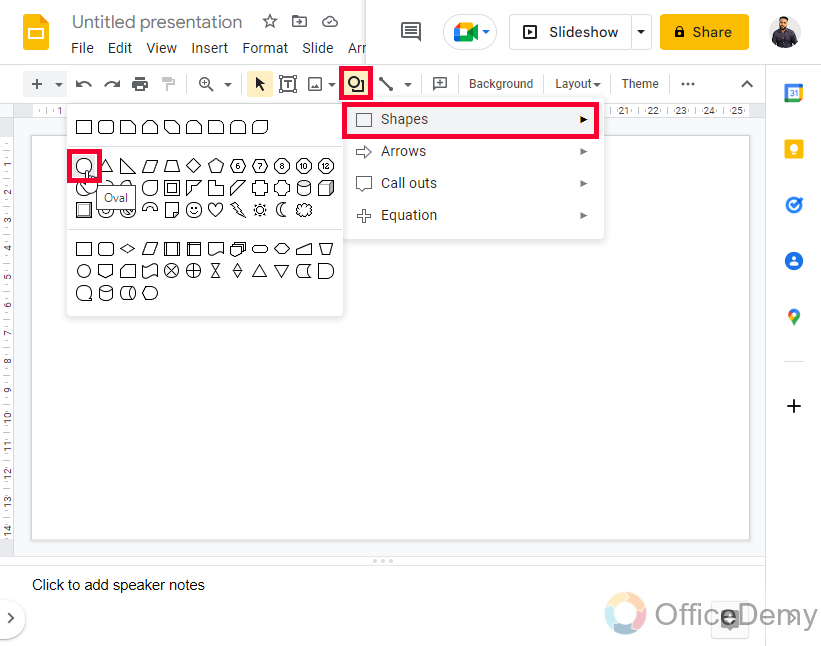
- Select “Shape” > “Shapes” > “Oval” to create the first oval shape.
- Create another oval.
- Place it slightly on top to ensure they overlap.
- Customize both.
- Adjust the transparency of overlapping areas.
- Add and format text.
- Group both circles together to keep them aligned using the “Group” function (Ctrl + Alt + G).
OR
- Go to “Insert” > “Diagram” > “Relationship” in Google Slides.
- Select the Venn diagram.
- Customize the diagram.
- Adjust additional formatting using the format options.
Hi, and welcome to another article in our Google Slides series. In this article, we will learn how to make a Venn diagram on Google Slides. If you want to give an awesome presentation, using diagrams is great, and the Venn diagram is mostly used to illustrate the relationships and mutual exclusiveness of two elements having some dependencies on each other. The Venn diagram can be very useful because they make your data look nicer and help your audience understand your points.
Venn Diagrams can be used for various purposes, such as they can be used as infographics in Google Slides. They look like infographics and are used mainly to represent the set theory. or they are used to show in a graphic way how the combination of one or several elements delimited by closed lines in a closed-end proportion of the body, in such a way that the elements of each group remain inside them with some part depending on the level of their dependencies
For this tutorial, circles or ovals are used to make Venn diagrams, that converge in an area called “intersection” which represents the elements that overlap between two elements within the same body or can be said as “universe“.
In this tutorial, I will teach you how to make a Venn diagram on Google Slides. So, let’s get started.
Importance of Venn Diagram on Google Slides
The Venn diagram is named after British mathematician John Venn the year 1880 published their idea. His work was privileged “On the diagrammatic and mechanical representation of propositions and reasonings”, in which he introduced the representation system we use today.
John Venn created a method that streamlined the expression systems formerly used for set theory. His idea took as its starting point the “Eulerian circles“, diagrams that were hypothesized by the mathematician Leonard Euler.
We used to represent the relationships of entities and their functional and non-functional dependencies on other elements within the same universe. Therefore, it can be a handy diagram or tool to visualize many types of data and for relationship modeling in Google Slides. So, therefore, we need to learn how to make a Venn diagram on Google Slides.
How to Make a Venn Diagram on Google Slides
We have so many components of a Venn Diagram in general. We have to know them and learn why they are used before learning how to make a Venn diagram. So, let’s start with its components, and then we will move ahead to start making a Venn diagram on Google Slides.
Components of a Venn Diagram
To accurately understand Venn diagrams, you must learn the name and functions of each of the components that make up the diagram
- Union – Unions are the sets of information or elements that you want to use in the Venn diagram, which is usually a circle.
- Set – Set is the sum or the combination of all the sets or circles of the Venn diagram.
- Intersection – Intersections are the overlapped areas in the Venn diagram and they show what various elements have in common. They are also called “subsets“.
- Symmetric difference – Symmetric difference is the result of the discrepancy of several sets or represented differently, it is everything besides the conjunction formed among several circles.
- Relative complement – Relative complement is a unique part of a subset that does not tumble within the intersection
- Absolute complement – Absolute complement is the area that is not part of a set, which also contains the surface encompassing the ovals or circles.
- Universal set – Universal set is the area encircling the sets that form the Venn diagram.
Creating a Venn Diagram from Scratch on Google Slides
In this section, we will learn how to make a Venn Diagram on Google Slides from scratch. Making a Venn diagram is quite easy and it takes only just a few minutes and some easy steps. We can make it even in Google Docs and in Google Sheets using some tricks. Currently, our focus is on Slides. So, follow the below-described steps to make a Vann diagram from the scratch over a blank slide.
Tip: While creating an oval by mouse drag, press the Shift key to keep the aspect ratio locked, and the oval will be created in the perfect proportion.
Step 1
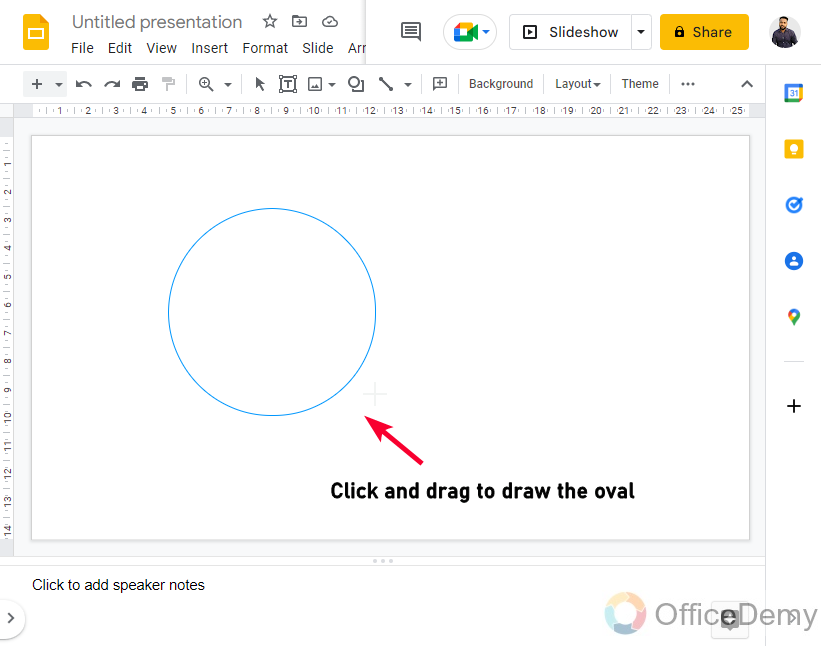
Click on Shape > Shapes > Oval. Then, click and drag to create the shape.
Step 2
Create another oval using the same method, and then place it slightly on top of the previous one.
To copy a shape, simply select the shape, and then drag it from the mouse anywhere while holding the Ctrl key
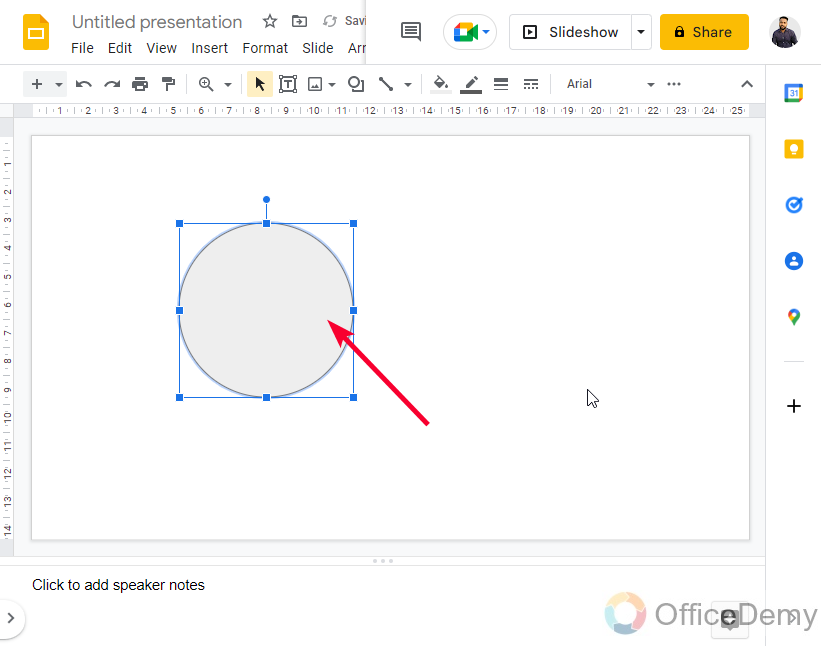
Step 3
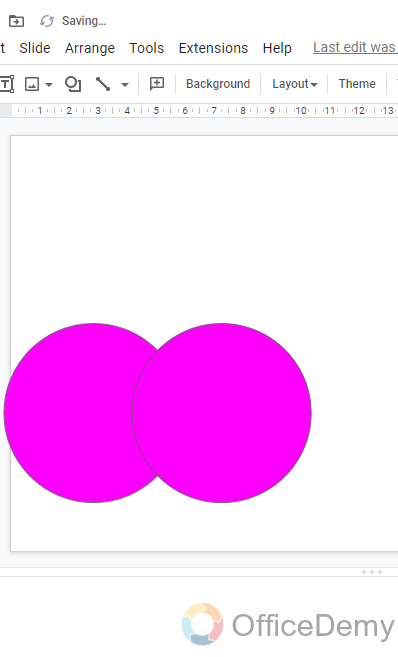
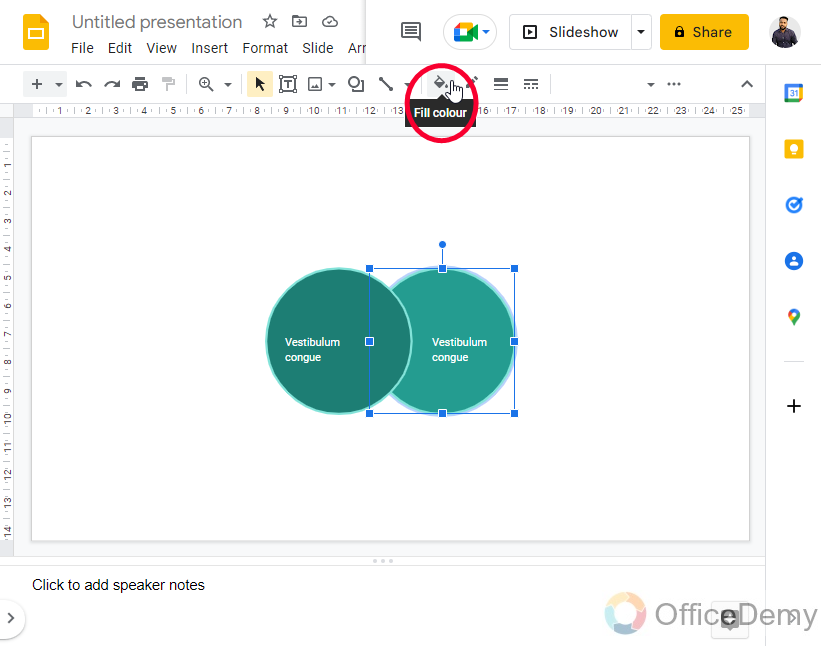
Now, a layout is created, now you need some designs that can change the fill color and border color of your ovals, you can keep them different colored for a good representation.
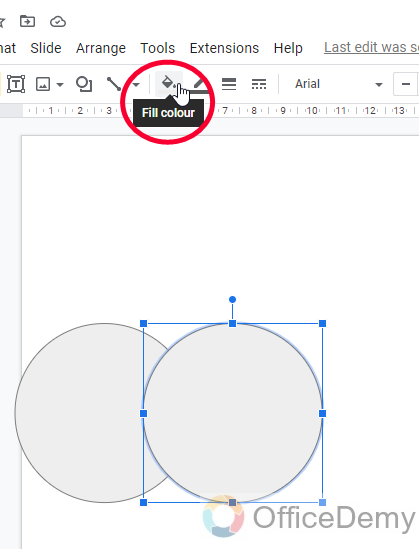
Select the object, go to Fill color in the toolbar, and pick a fill color for the object
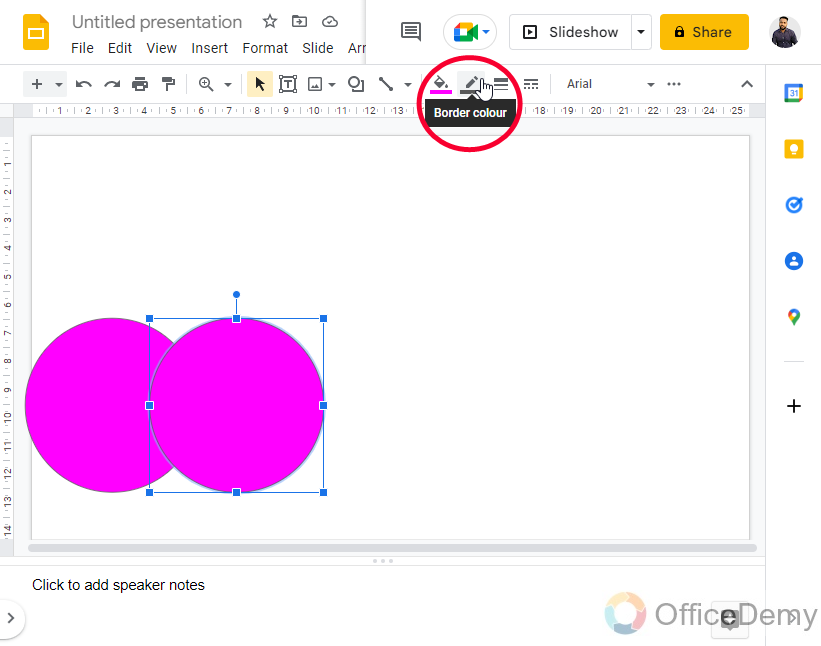
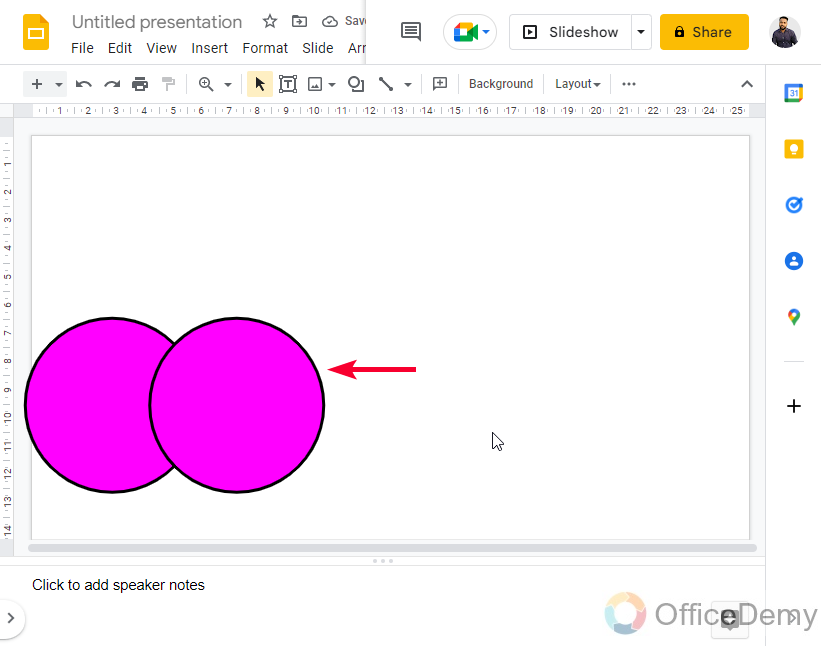
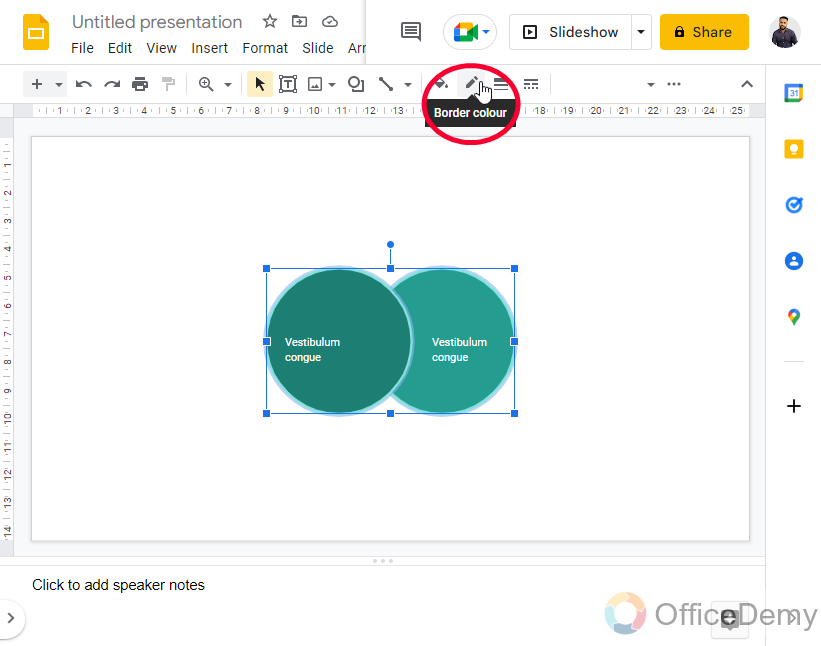
Then select the object and go to Border color in the toolbar, and pick a color for the border of the object
You can also change the border style and weight using adjacent options in the toolbar respectively.
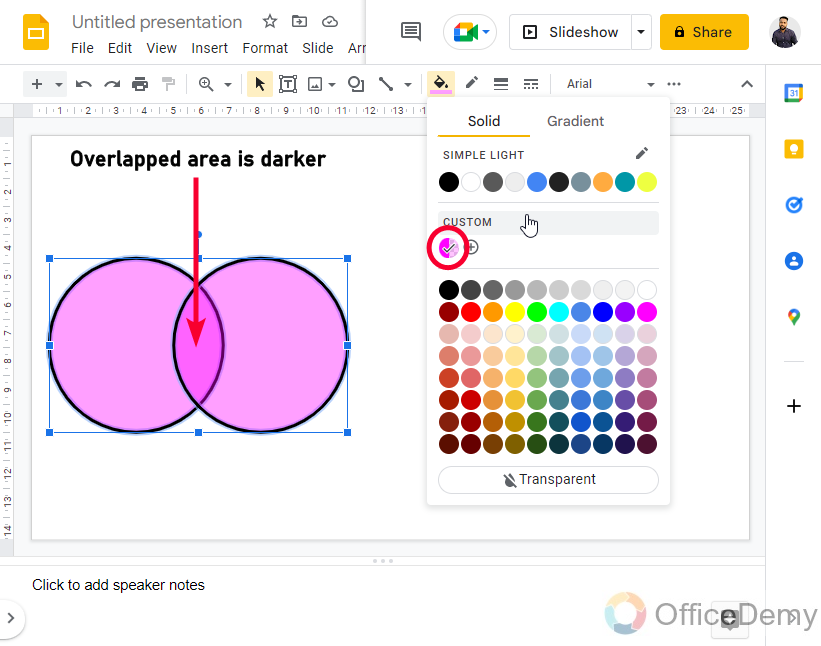
Step 4
You can use change the transparency of the circles in such a way that their overlapping part is highlighted.
To do this, you need to go to the Fill color, and then go to Custom which has a transparency meter for the fill color of the selected object. Click Ok when you are done.
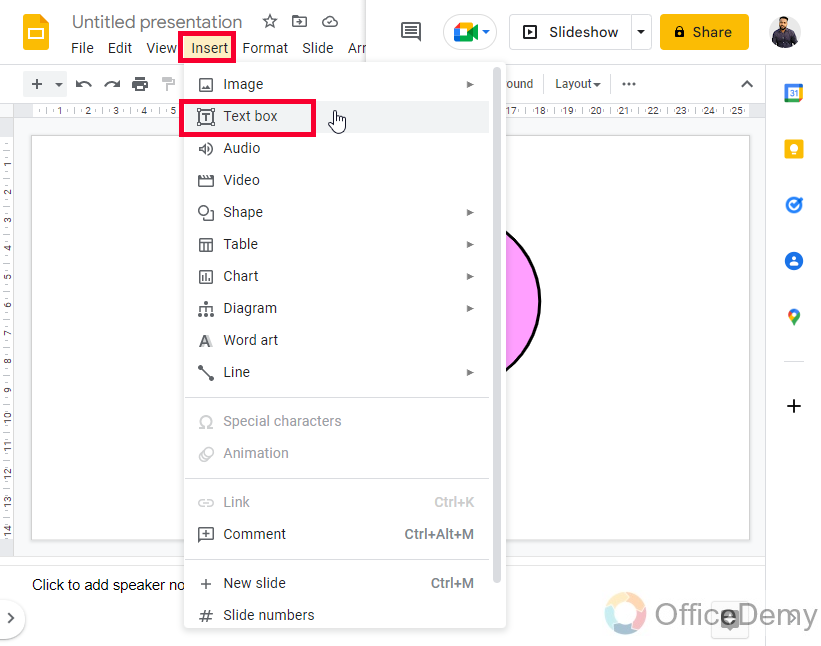
Step 5
Now, you need to add some text inside the circles, for that, you can go to Insert > Textbox, and then click and drag to create the textbox.
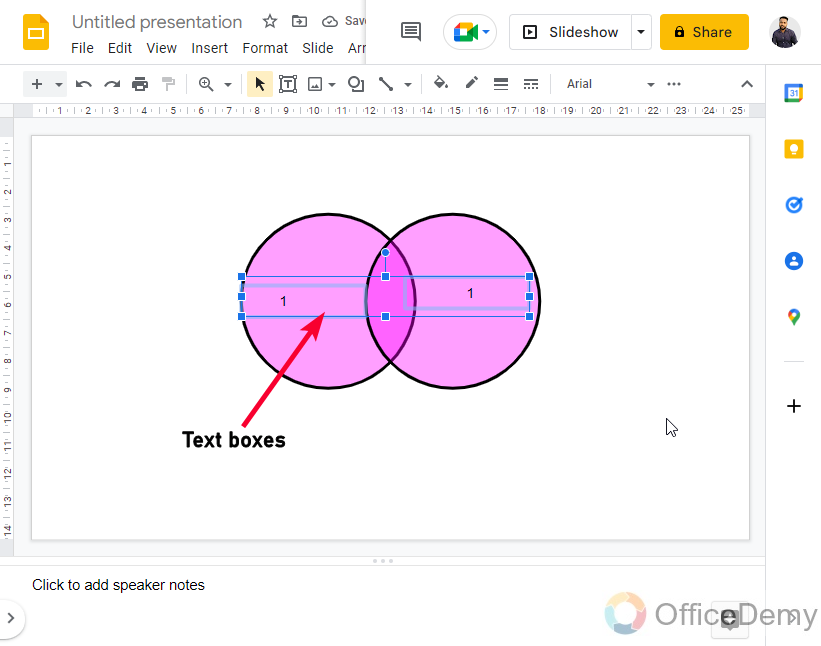
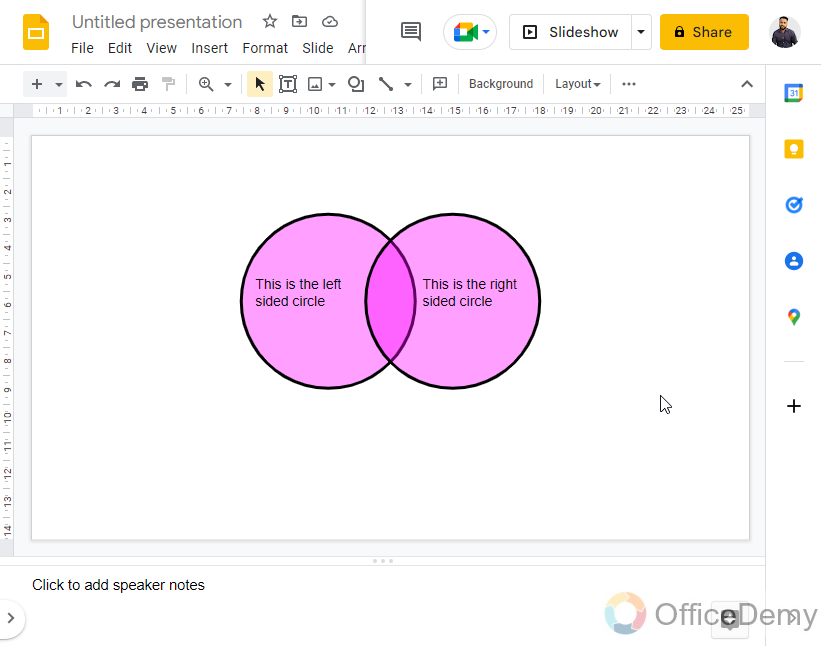
Step 6
Write down the text, and format it as per size, family, and other formatting you may want to use
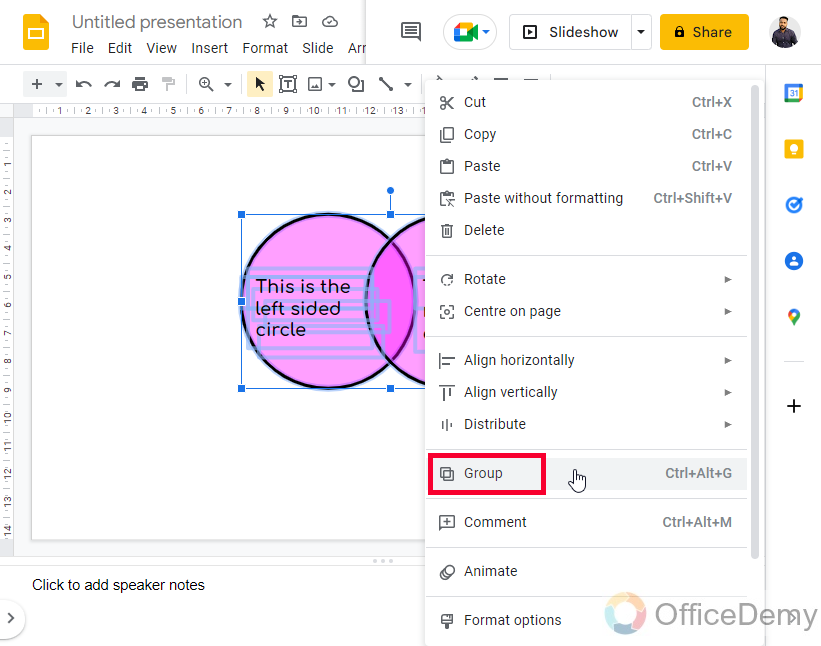
Step 7
Select both circles, right-click, then look for the Group button, and click on it to group both circles, so that they don’t break when you resize them or move them.
Ctrl + Alt + G is the shortcut key
This is how to make a Venn Diagram on Google Slides from scratch.
How to Insert a Venn Diagram as a Template on Google Slides
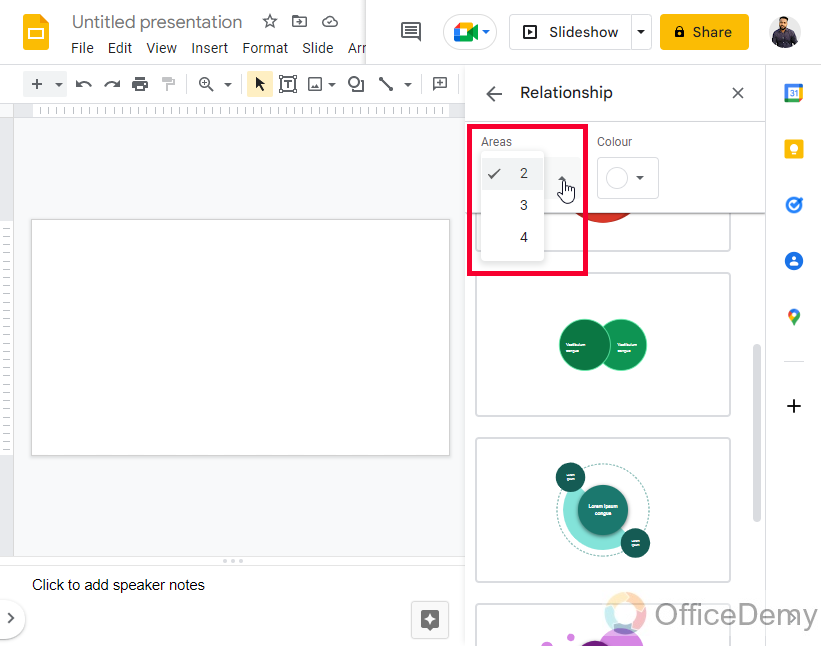
In this section, we will learn how to make a Venn diagram on Google Slides using the built-in diagrams in Google Slides. We have Grid, Hierarchy Timeline, Process, Relationship, and Cycle diagrams in Google Slides. We can go to Relation, and from the available diagrams we can pink a Venn diagram, we can also select the main color theme for the diagram from the above drop-down in the Relationship Diagram Section, and can also select areas means the number of circles in our diagrams. So, let’s see how we do it using this method.
Step 1
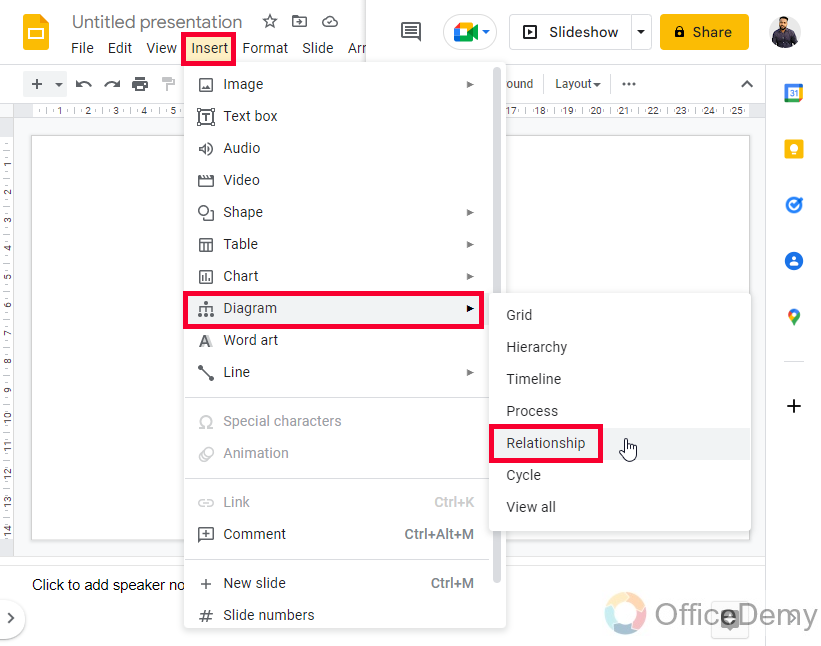
Firstly, go to Insert > Diagram > Relationship
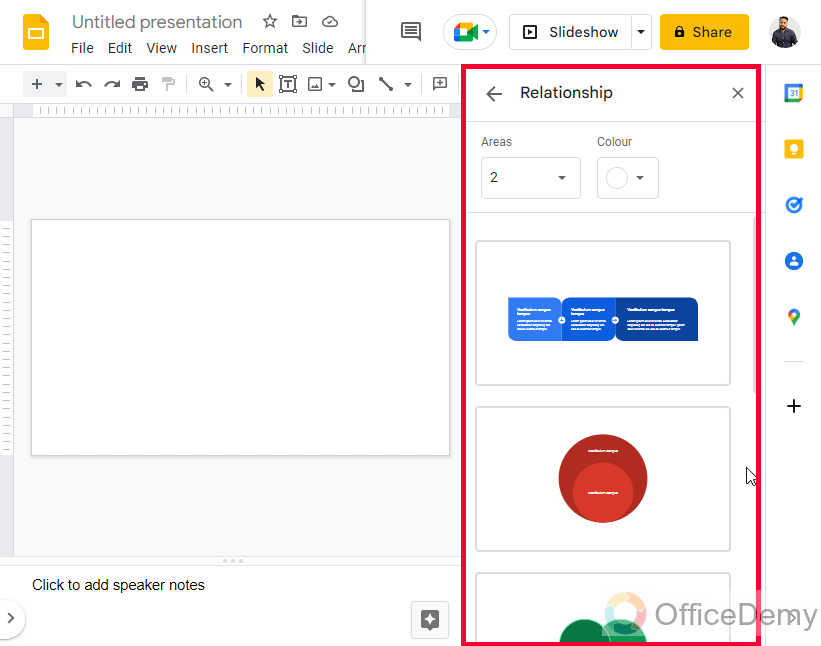
Step 2
A Relationship diagram box will appear on the right side of your page
Step 3
Scroll down, and look for a Venn diagram in the list
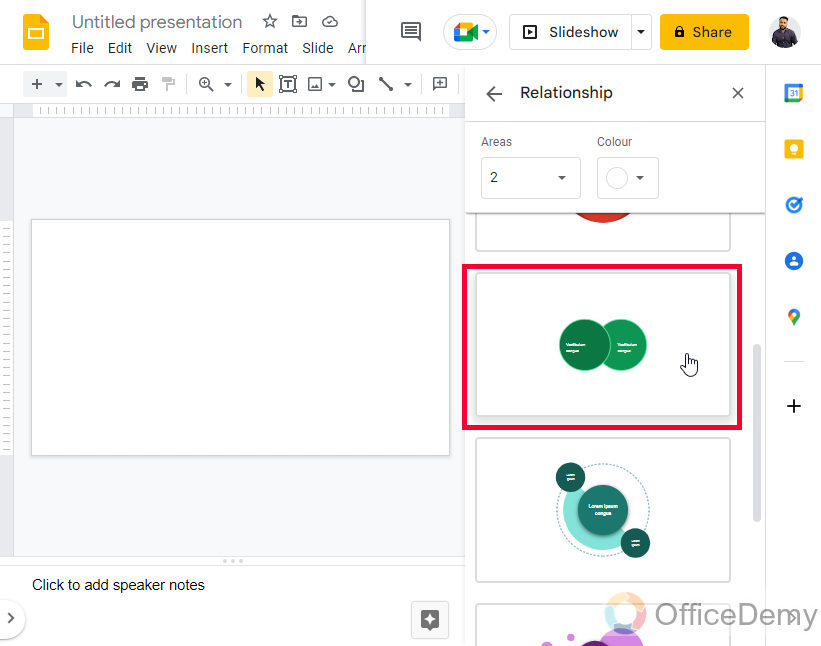
Step 4
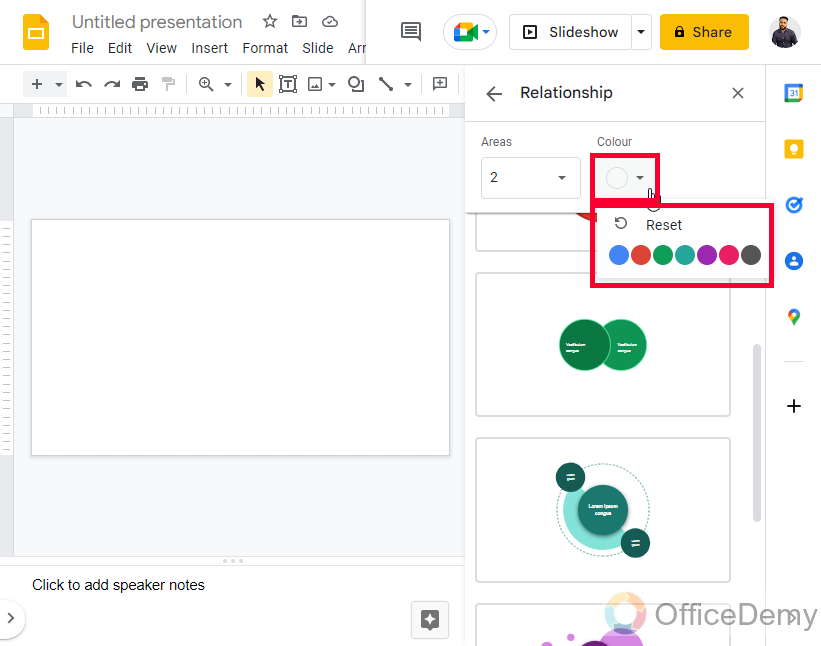
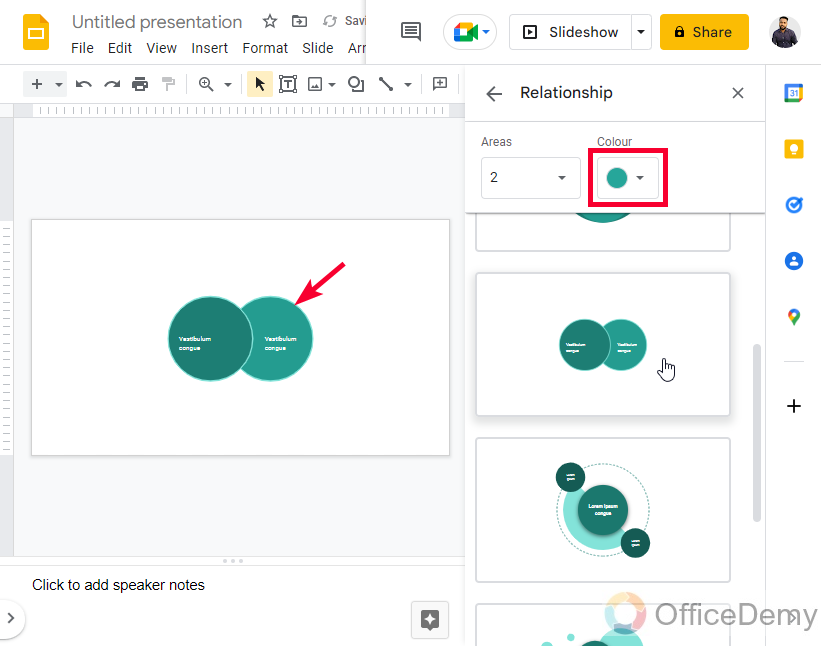
Once you find it, click on it and add this diagram to your slides, if you want to change colors, you can use the above color drop-down, and if you want to change areas, you can use the above area drop-down.
Step 5
Click on the diagram to add it to the page
Step 6
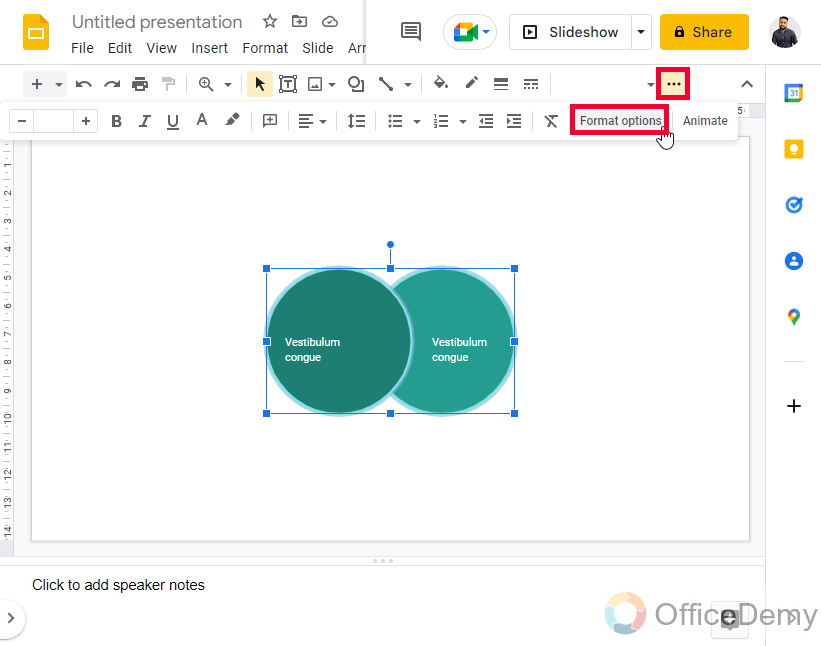
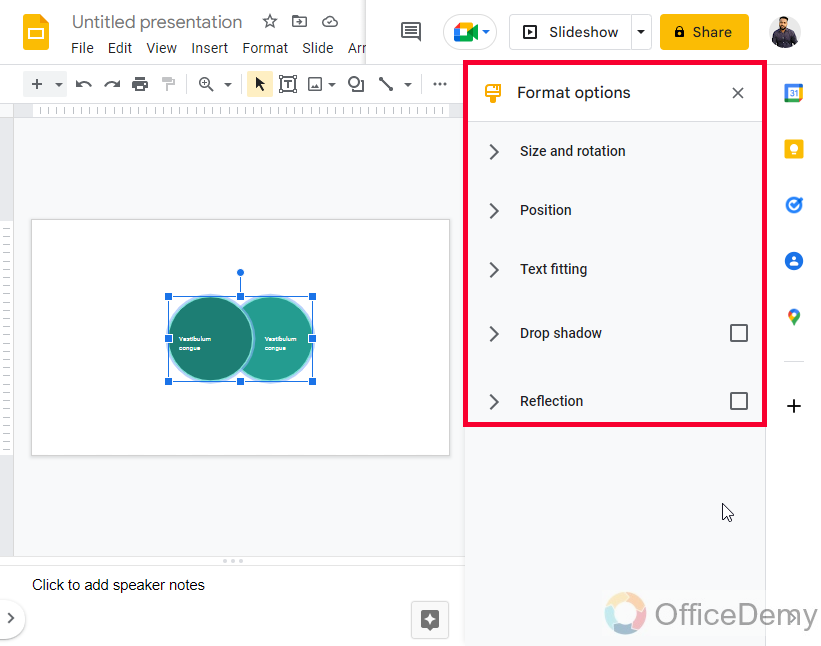
Your Venn diagram is successfully added to your slide, you still can change the colors, the position, and the sizing, and can also use the format options button to further format this diagram and can add various effects like drop-shadow, and reflection, and can also control the transparency level of the shadow and reflection
This is how you can add a premade template of a Venn Diagram directly from the Diagrams inside Google Slides without using any external application, a third-party add-on, or a browser extension.
We may have more superb templates available online, and we can get them using browser extensions, and Google Slides add-ons, and we can also get them externally via some applications. But I feel these two methods are enough to make a Venn diagram on Google Slides. If you want to have a unique or very detailed template of the Venn diagram, you can get it from the internet, and can surely use it by importing it to Google Slides.
I recommend using the first method, which is creating a Venn diagram from the scratch.
I hope you find this article helpful and that you have learned two good ways to make a Venn Diagram on Google Slides.
Frequently Asked Questions
Can I Use the Same Methods to Create a Venn Diagram on Google Slides as in Google Docs?
Creating a Venn diagram in Google Slides follows similar methods as in Google Docs. However, the keyword venn diagram creation in google docs specifically pertains to creating this type of diagram in Google Docs, which may have slight variations from creating it in Google Slides.
How can we quickly make a Venn diagram on Google Slides?
You have mainly three ways to make a Venn Diagram on Google Slides. The first and most recommended method is to create a Venn Diagram using shapes, colors, and text boxes in Google Slides, without getting anything outside the Google Slides. Since the diagram layout is pretty easy it only required to draw two or more correspondent circles, and place them very close to each other, so that they overlap some part of each circle to look like a Venn diagram. The other way is to insert a Venn diagram from the Diagram section or use a third-party Google Slides add-on to import Venn Diagram on Google Slides.
Conclusion
Wrapping up how to make a Venn Diagram on Google Slides. We have learned two quick and easy methods to make a Venn Diagram on Google Slides. I hope you find this article helpful and that you have learned so much new from it. I will see you soon with another helpful guide, till then take care and keep learning Microsoft Office and Google Workspace with Office Demy. Thank you.


