
To Make a Stacked Bar Chart in Google Sheets
- Select the Data range.
- Go to the Insert tab.
- Click on the Chart option.
- Open Chart Editor.
- Select Stacked Bar Chart type.
Welcome back, fellows. Today, we are learning how to make a stacked bar chart in Google Sheets. A stacked bar chart is a chart type that represents data into bars that divide data into sub-bars to visualize data. As we all know inserting a chart in Google Sheets is a Child’s play, you can insert a chart with just one click. Then you can convert your chart into a stacked bar chart by changing its type. If still, you are confused about making a stacked bar chart in Google Sheets then read the following tutorial on how to make a stacked bar chart in Google Sheets.
Why do we use a Stacked Bar Chart in Google Sheets?
A stacked bar chart makes it easy to compare sets of data between different groups briefly. The purpose of a stacked bar chart in Google Sheets is to present numerous data in a graphical image so that users can easily study and understand the calculations and can find the difference with visuals.
Therefore, I have brought up this topic for you, how to make a stacked bar chart in Google Sheets.
How to Make a Stacked Bar Chart in Google Sheets
To create a stacked bar chart in Google Sheets, first you will have to insert a simple chart in Google Sheets then select stacked bar chart from chart types in the chart editor. Let me show it practically in the following step-by-step guide.
Step 1
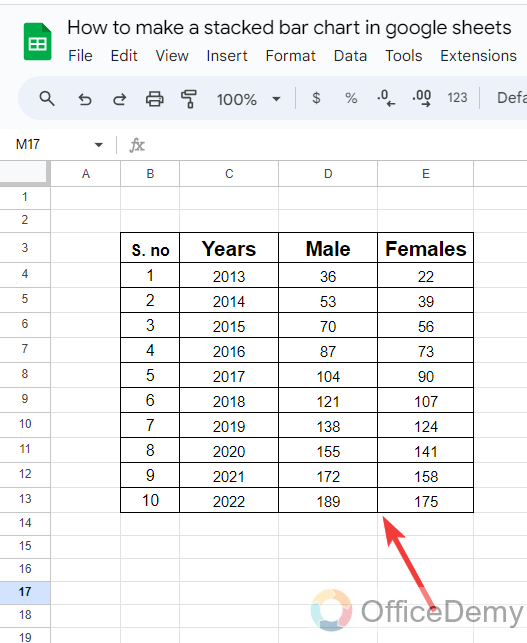
First, to make a stacked bar chart in Google Sheets, you will need a table, or such type of chart data as shown in the following picture in which we have two different values of Males and Females for different years.
Step 2
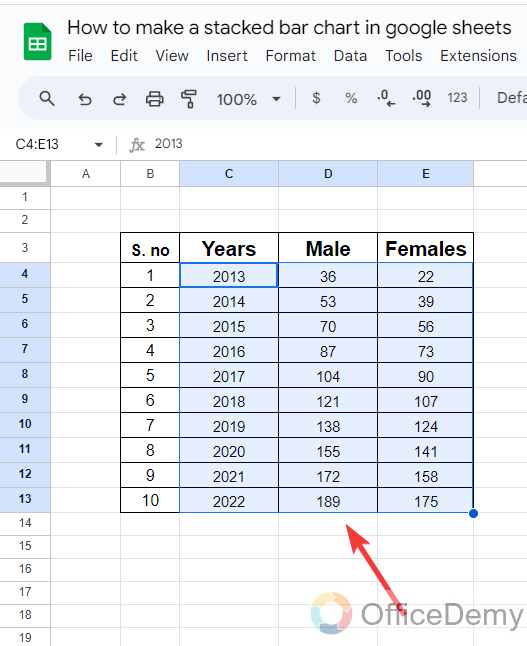
Once you have created a table for sample data select all the values by hovering the mouse on it or by dragging click on it as I have selected in the following example.
Step 3
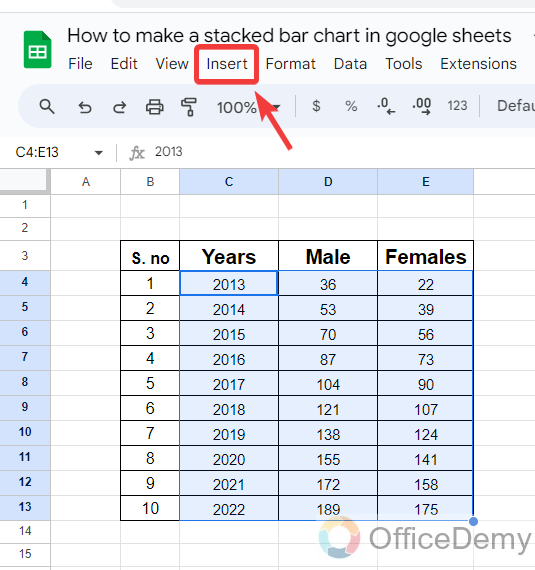
After selecting the data, insert a stacked bar chart and go into the “Insert” tab from the menu bar of Google Sheets as highlighted in the following screenshot.
Step 4
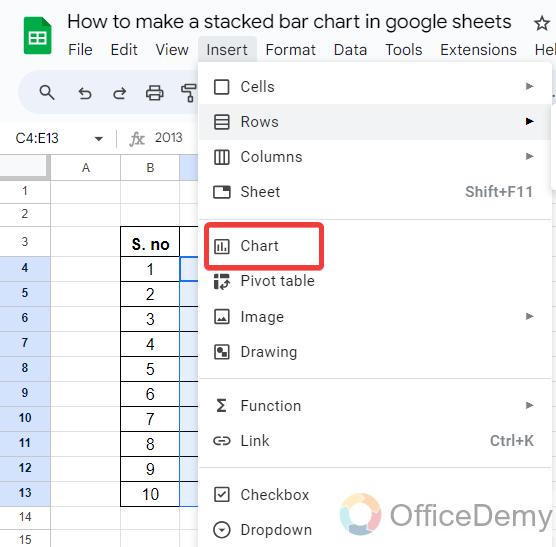
When you click on the “Insert” tab from the menu bar, a drop-down will drag down in which you will see a “Chart” option as highlighted in the following picture, you can insert a chart by just clicking once on it in Google Sheets.
Step 5
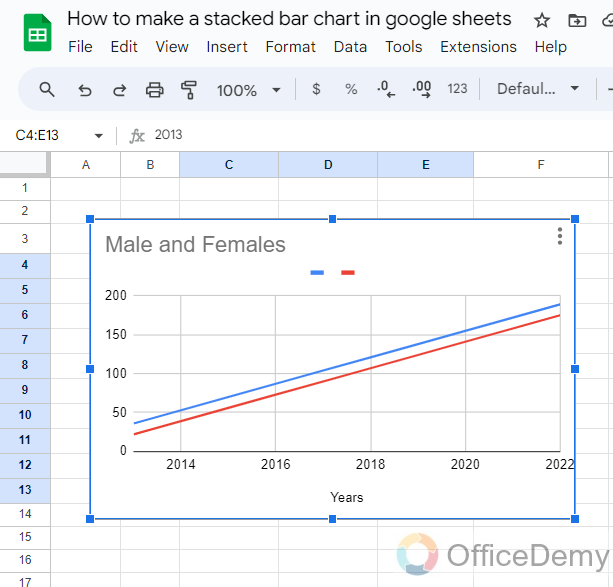
The result is in front of you as you can see below in the screenshot that the chart has been inserted, but this is a linear chart and we have required a stacked bar chart. Let’s see how we can change this chart into a stacked bar chart.
Step 6
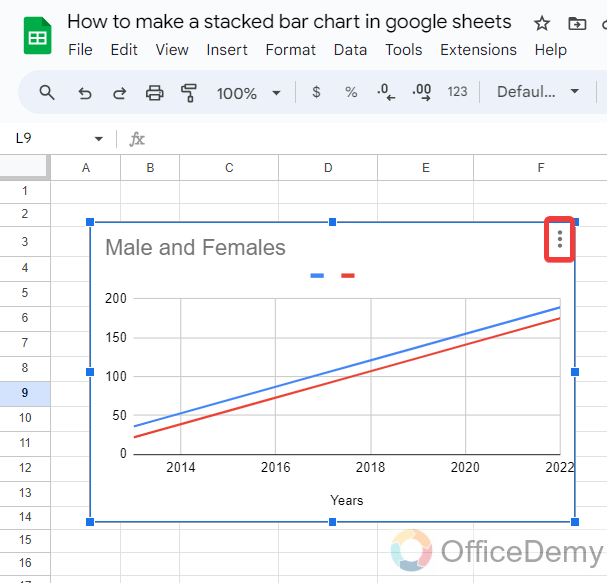
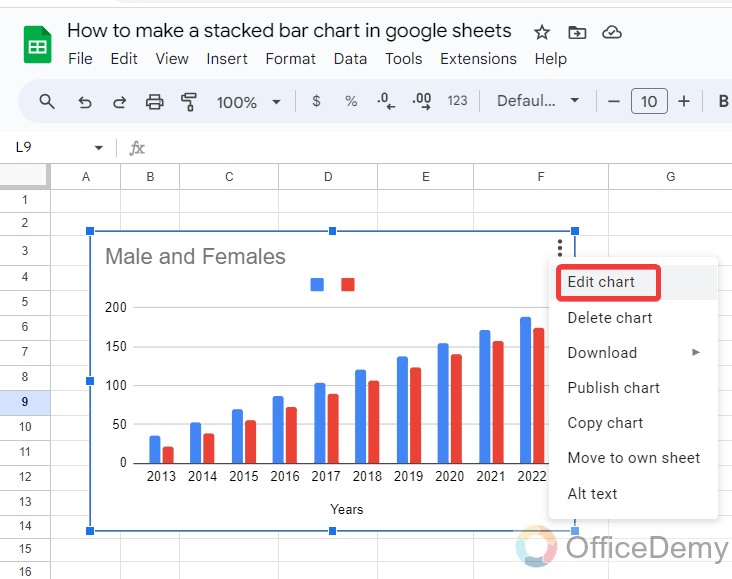
When you click on this chart, you will see a three-dot button at the right top corner of the window as highlighted below. Click on it to open its properties.
Step 7
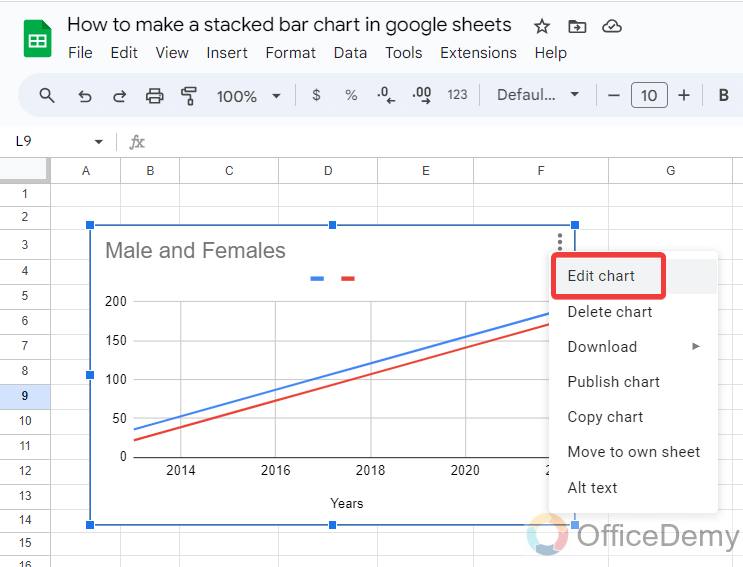
Clicking on this three-dot option will give you a small drop-down menu, in this drop-down menu you will have an “Edit chart” option through which you can edit your chart in Google Sheets.
Step 8
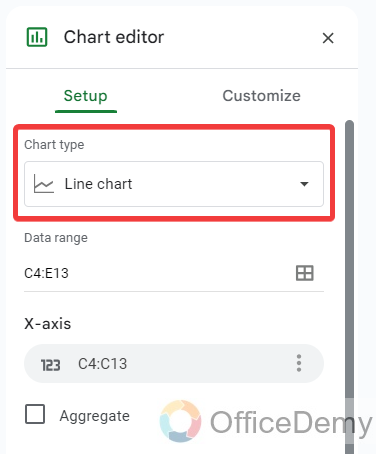
When you click on that “Edit chart” button, a pane menu as a Chart editor will open on the right side of the window. On this panel or pane menu, the first option you will see will be the “Chart type” as highlighted below. With the help of this option, you can change the type of your chart.
Step 9
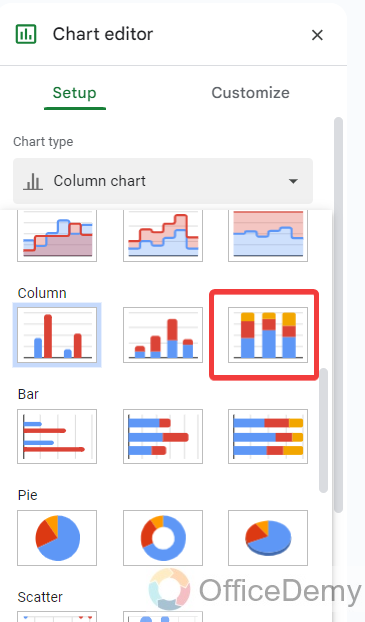
When you open the “Chart type” option, you will see plenty of varieties for different types of charts as we have required a stacked bar chart so, select a stacked bar chart according to your preference from the following list.
Step 10
As you select your required chart from the chart types of list, your linear chart will instantly change into the stacked bar chart as can be seen in the result in the following picture.
Frequently Asked Questions
Can I Use the Same Method to Create a Bubble Chart in Google Sheets as I Would for a Stacked Bar Chart?
Yes, you can use the same method to create a bubble chart in Google Sheets as you would for a stacked bar chart. The process involves selecting your data, opening the Insert menu, choosing Chart, and selecting the Bubble chart option. From there, you can customize your chart based on your preferences. So go ahead and create a bubble chart in sheets effortlessly.
Can I Change the Color of the Stacked Bar Chart in Google Sheets?
Yes, it is possible to change the color of a stacked bar chart in Google Sheets by customizing chart color. Simply select the desired bar chart, navigate to the Customize tab, and choose the Chart Style section. From there, you can modify the color settings to create a personalized and visually appealing chart.
Are the Steps for Creating a Stacked Bar Chart the Same as Creating a Regular Chart in Google Sheets?
Creating visual charts in sheets can be a breeze, but are the steps for creating a stacked bar chart the same as creating a regular chart? The answer is yes! Whether it’s a stacked bar chart or a regular chart, Google Sheets allows users to easily customize and create various visual representations of data using simple steps.
How to label a stacked bar chart in Google Sheets?
Data labels are used to display source data in a chart. Labels help the reader to read and understand a chart easily. Sometimes labels are generated by default from the source data but if your chart does not have labels then the following are the steps to label your chart in Google Sheets.
Step 1
Once you have inserted a chart in Google Sheets, to label your chart go into the edit mode of the chart by clicking on the three dots option then click on the “Edit chart” option from the drop-down menu.
Step 2
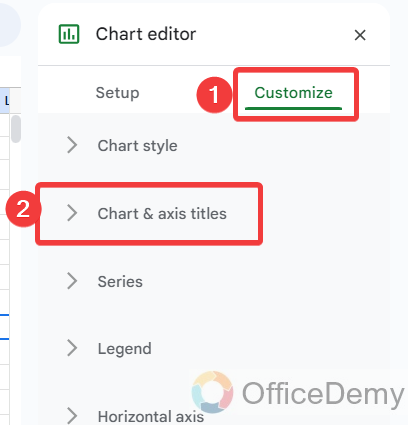
Once you have opened a chart editor, you will see a couple of tabs in your chart editor, click on the “Customize” tab. When you click on the “Customize” tab, you will see several options listed in which click on “Chart & axis titles“.
Step 3
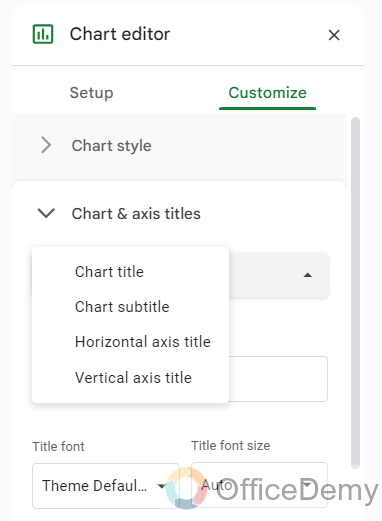
When you click on “Chart & axis titles“, it will expand to several options where at first you will see the label chart drop-listed option. You can add or change all chart labels from this drop-listed menu.
Step 4
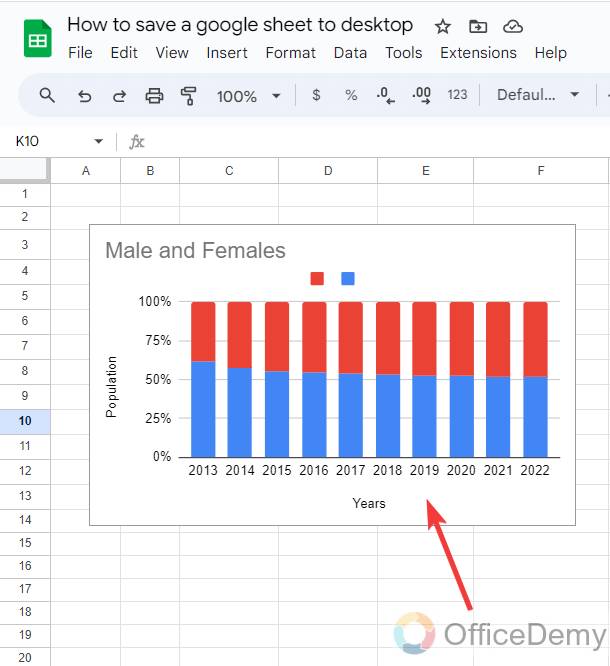
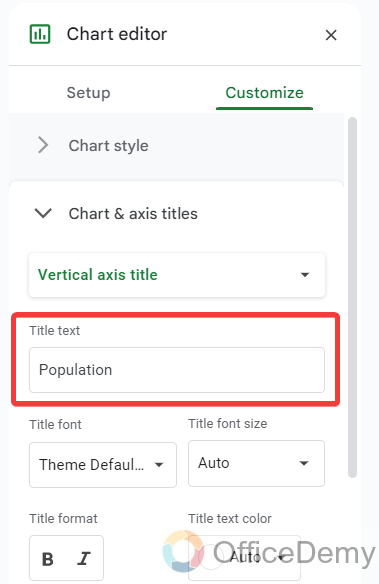
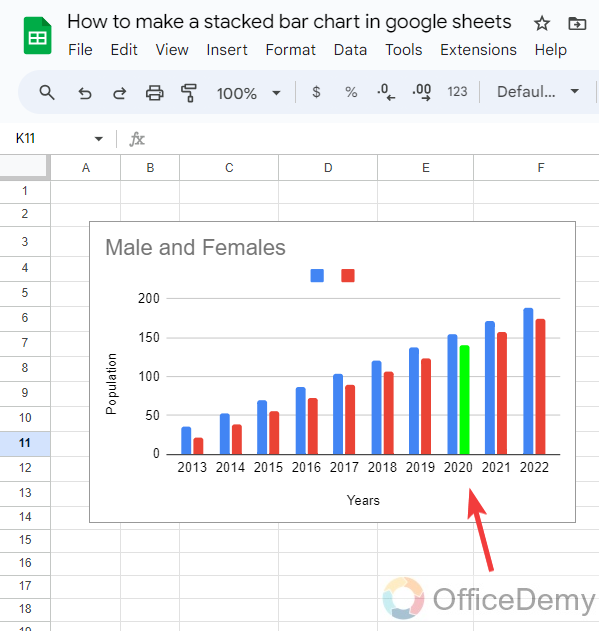
Let me show you an example by adding the label of the vertical axis. Once you have selected a drop-listed option, a text box will appear just next to this drop-listed option where you can easily insert your label for your chart and chart axes as I have returned “Population” for the vertical axis in my chart.
Step 5
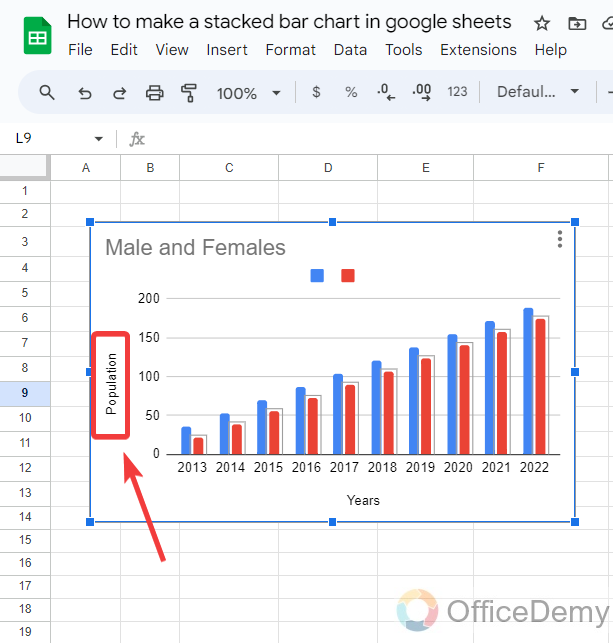
Once you have edited your chart simply close the panel and see the result as you can see in the following example, we have labelled our vertical axis by “Population“.
How to format a data point in a stacked bar chart in Google Sheets?
Data point format is a feature of Google Sheets through which you can highlight a specific point in your chart to prioritize any data in the chart. With the help of the following steps, you can format a data point in your chat in Google Sheets.
Step 1
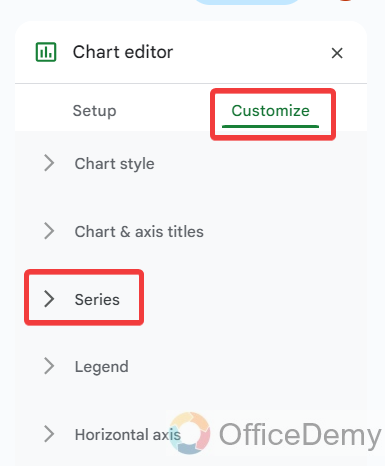
After opening the chart editor again go into the “Customize” tab then go into the “Series” option from the list as highlighted in the following picture.
Step 2
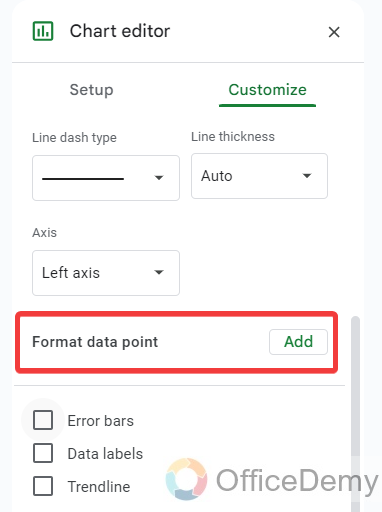
When you open the “Series” option in your chart editor, on a little scrolling down you will find a “Format data point” option built-in in the panel as highlighted below. To add a format data point in your chart, click on the “Add” button.
Step 3
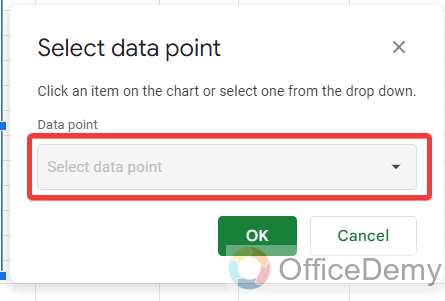
When you click on the “Add” button, a small pop-up window will appear in front of you, on this window you will have to select the data point where you want to format it by clicking on this drop-listed option.
Step 4
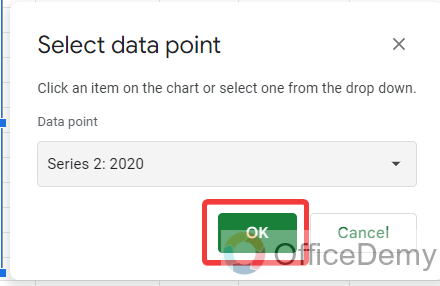
When you click on the “Drop listed” menu, you will see all the points that are placed in your chart. Once you have selected the data point simply click on the “OK” button.
Step 5
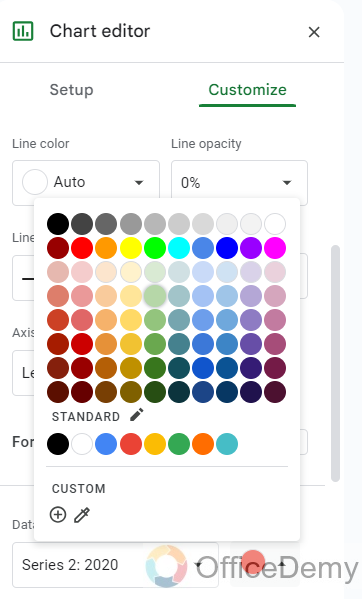
As you click on the “OK” button, Google Sheets will ask you for the color by which you want to format the selected data point. Select your desired color from the following color gallery.
Step 6
You are almost done now; you can see the result in the following picture that your selected data point has been formatted in your desired color.
How to download a stacked bar chart in Google Sheets?
Charts are the best way to display data and characterize your data into blocks. It provides attractive and easy visuals to study any kind of data analysis. Let’s suppose you are creating a presentation in which you want to present a chart that you have created in Google Sheets. Then with the help of the following steps, you can download your Chart separately and can easily attach it to your presentation.
Step 1
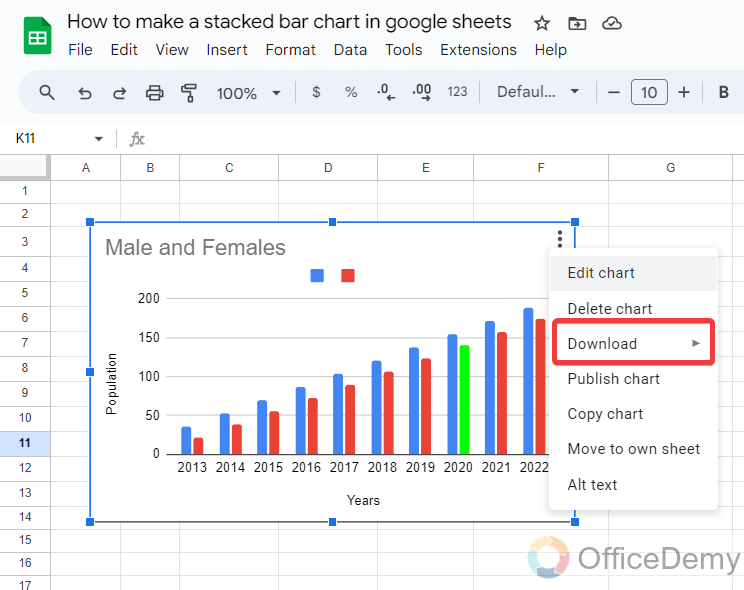
Click on the three dots option from your chart, you will see a “Download” option in the drop-down menu as highlighted in the following picture.
Step 2
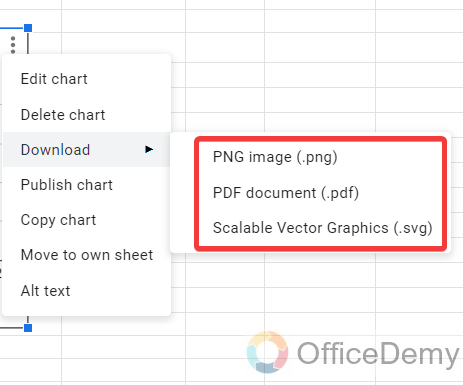
When you click on this download button, another expand menu will open where you will see different kinds of file formats in which you can download your stacked bar chart in Google Sheets. Just select the format, and your chart will be downloaded.
Conclusion
The best way to visualize data with more than two columns of numerical values is to make a stacked bar chart as we have covered in the above tutorial on how to make a stacked bar chart in Google Sheets.


